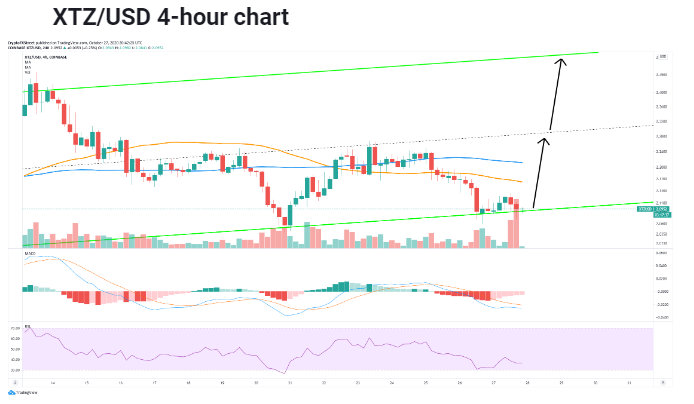
XTZ faces potential bearish breakout at the $1.77 level as it is trading inside an ascending parallel channel. In our Tezos price news, we are reading more about the price analysis.
XTZ is now trading at $2.08 right at the bottom of the ascending parallel channel that was formed on the daily charts. the digital asset is down by more than 50% since its 2020 high at $4.47 that was established in August 12. The breakout of the critical support level will be devastating for the coin as ont eh daily charts the price is bounded in the ascending parallel channel. The current price is right above the lower trendline at $2.07 while the MACD is on the verge of going bearish for the first time since September 19.

The breakout below the criticial support level at $2.07 could boost the price of Tezos down by 16% which is actually the bottom trnedline for the top one. This will represent a price target of about $1.77 as XTZ faces potential bearish breakout. On the 4-hour charts, XTZ lost the 50-SMA and the 100-SMA but the bulls are defending the critical support level of $2.07. the MACD is going bullish as well after the rebound thanks to the oversold RSI. The bounce can drive the price of XTZ up to the middle trendline of the ascending channel at $2.3 which turned the 50-SMA and 100-SMA into support levels. The long-term price target will be $2.5 with the upper boundary of the ascending channel.

We previously reported in our XtZ price news, The parabolic SAR and MACD suggest that Tezos is preparing for a bullish impulse but the smart contract token faces stiff resistance ahead. Only a candlestick close above the 100-twelve hour moving average will add more credibility to the optimistic outlook. The token is facing an uphill battle after falling more than 58% but there are still several technical indexes that suggest that the top 20 cryptocurrency is on a way for higher levels. Tezos faces uphill battle in a recent massive 58% correction and wants to stage a near-term price recovery but there’s a key hurdle that has to be overcome first. Each time the coin increased to a technical formation upper boundary, it gets rejected and retraces to the lower edge but from this point, it tends to rebound and remain consistent with the characteristics of the channel.
DC Forecasts is a leader in many crypto news categories, striving for the highest journalistic standards and abiding by a strict set of editorial policies. If you are interested to offer your expertise or contribute to our news website, feel free to contact us at [email protected]


Discussion about this post