Tezos technicals show price is getting ready for an impressive upswing as it is holding above the critical area of support. Based on the history of prices and charting patterns, XTZ could even make gains of 100% so let’s see the analysis in the latest TEzos price news.
Following a 60% correction, Tezos is showing signs that it’s ready to recover these losses. Multiple technical indexes turned bullish which suggests XTZ’s downtrend reached exhaustion. If the buy orders start piling up, XTZ could increase from $2.2 to $4 or even higher. Tezos seems to be on the cusp of a major price movement as the technical indicators predicted that a spike in demand could push the XTZ prices close to the all-time high of $4.44. Tezos technical show that the coin experienced a steep correction after making a new all-time high as the smart contact token went from trading at a record high of about $4.5 to hit a low of $1.9 which marks a 57.9% downside.
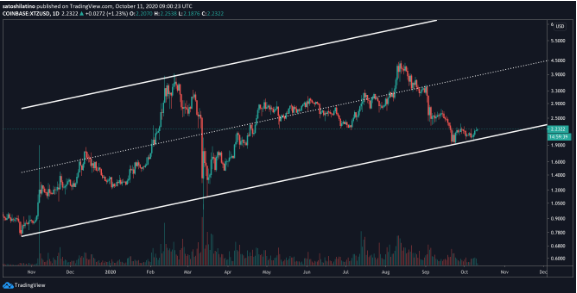
Despite the massive losses which were incurred over the past two months, different technical indexes suggest that this cryptocurrency is poised to rebound soon. Looking at the daily charts of the coin it seems that the prices are contained in an ascending parallel channel that developed since October 2019. The prices bounced off from the upper and lower boundaries of the channel and were consistent with the expected coin behavior of the technical pattern.
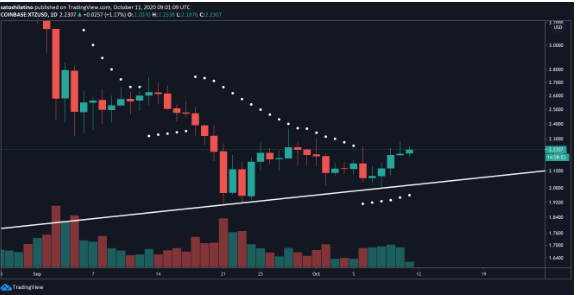
Tezos reached the bottom of the channel history which could mean that the price movement might repeat itself. A spike in buying pressure around the price level now could lead the coin to regain some ground and march towards $4 or higher. This move is dependent on the strength of the support level set at $2. The parabolic movement adds credence to the optimistic outlook as this trend following indicator shows that the downtrend of the coin reached exhaustion based on the daily chart. Each time the stop and reversal points go below the asset’s price, it is seen as a positive sign. The recent flip only shows that this altcoin trend is changing from bearish to bullish.
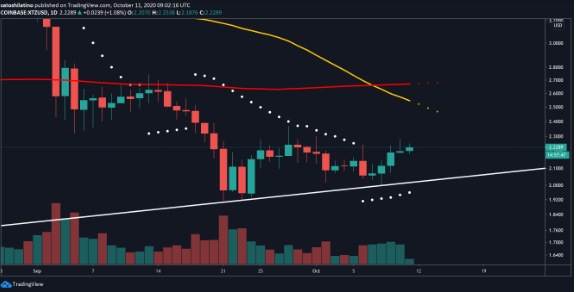
The stop and reversal system was effective in determining the trajectory of the coin as the last two times the SAR flipped from bearish to bullish around the lower boundary of the ascending parallel channel which is when XTZ skyrocketed by 150%.
DC Forecasts is a leader in many crypto news categories, striving for the highest journalistic standards and abiding by a strict set of editorial policies. If you are interested to offer your expertise or contribute to our news website, feel free to contact us at [email protected]







Discussion about this post