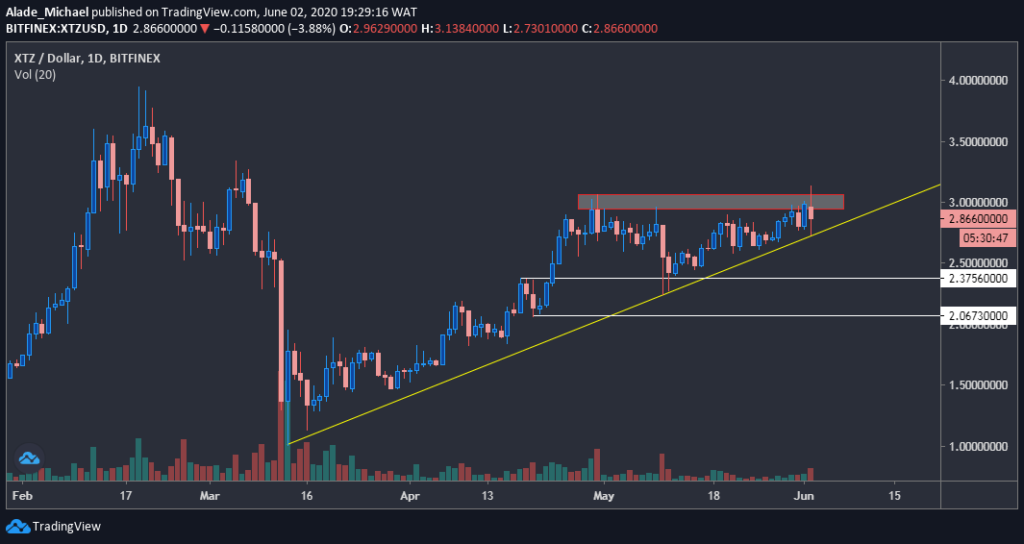
Tezos bounces black right after the false breakout of the $3 level yesterday as XTZ dropped to $2.73 following Bitcoin’s dump over the day. In the latest Tezos news we take a closer look at the price analysis.
The bullish trajectory is still much valid for the trading pairs but the price remains indecisive. The price could also bounce back if Bitcoin is able to hold the $9500 level as a support level. After the prolonged consolidation period, Tezos saw a slight surge of 6% and reached a three-month high of $3.15 yesterday, June 2. However, all of this turned into a 1.5% loss in under 15 minutes following the Bitcoin’s dump yesterday. Tezos now roams around the $2.87 after losing the $3 key level. the price could bounce back if Bitcoin holds the $9500 level but it could be hard for Tezos to regain momentum if the buyers don’t regroup above the important $3 level.

In the meantime, the bullish trajectory of XTZ stays valid as the yellow trend line continues holding. It is too early to consider a drop although the price recovery over the past month is quite noticeable on the daily chart after the false breakout. A possible double top pattern could reverse the trend. If the price drops below the weekly low of $2.73, the next potential support to keep in mind is the $2.35 after the key level of $2.06. However, $1.8 could also come into play if the pressure continues. This $3 level could be a good starting point for a fresh increase but it would need a clear high of $3.15 before rising further to the $3.3 and the $3.94 which is the current high of the year.
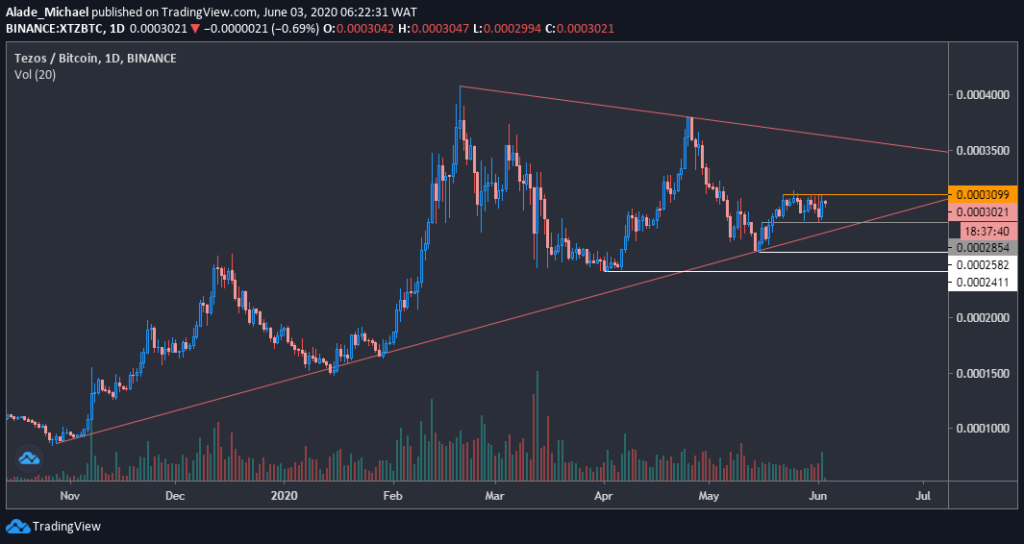
Tezos bounces back as further actions can be expected as soon as trading volume evaporates back in the market. XTZ remains bullish on a short-term perspective. Tezos is consolidating against Bitcoin after the rebounded level of 2500 SAT in May. The price was facing key resistance at 3000 SAT level for some days now. The bullish trend is still valid on the charts but it could remain indecisive if the buyers fail to reiterate the short-term actions. There are some bears showing commitment to trade after the previous lower highs at 4000 SAT and the 38000 SAT levels.

The traders should keep an eye on the 35000 SAT around the triangle’s resistance. A break above it could send the price straight to 3800 SAT and the 4000 SAT which is holding the yearly high.
DC Forecasts is a leader in many crypto news categories, striving for the highest journalistic standards and abiding by a strict set of editorial policies. If you are interested to offer your expertise or contribute to our news website, feel free to contact us at editor@dcforecasts.com


Discussion about this post