
XLM loses 14% in 14 days as Bitcoin’s price dropped, and closed beneath the $0.075 and the 3-month trend line which suggests a strong correction. In today’s Stellar Lumens news, the price dropped by 8.5% after the weekly bearish close around $0.07.
The latest price crash for the entire crypto market caused a major loss for Stellar’s price over the past few hours. Earlier this month, it traded as high as $0.086 after seeing the three-month recovery from the $0.027 price point in March. The price is now trading around $0.0678 after losing 20% in two weeks. The weekly close below the 3-month ascending trend line which can be seen above the chart indicating a strong sell signal for the XLM/USD pair. In the meantime, the daily 8% correction is driving the price to a critical demand area so if the bears continue to accelerate the pressure, more drops can be expected in the upcoming days.
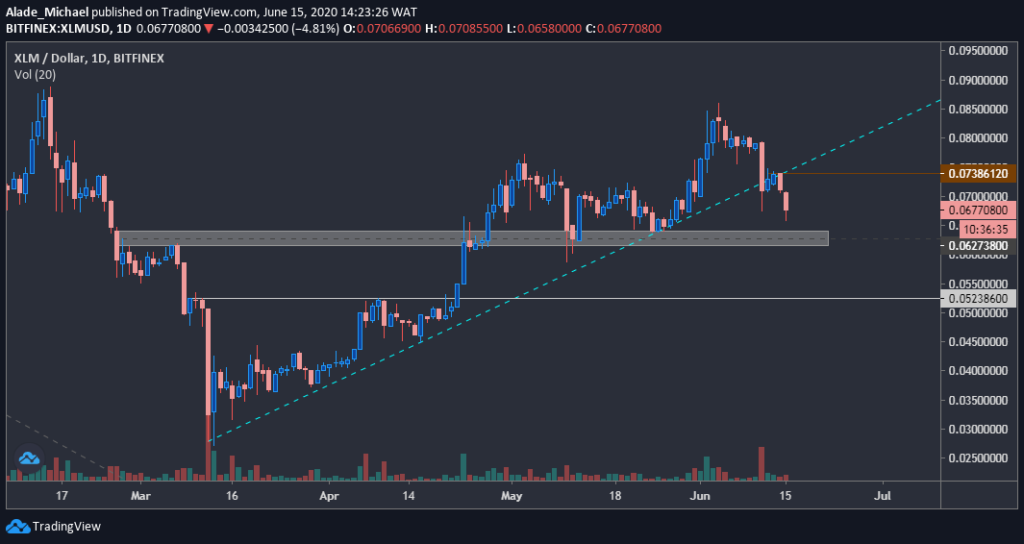
The bears could be suspended for a while if the crucial demand area holds strong at $0.0627. however, it could also start a worse scenario if a break down happens. The potential support to watch out now lies at $0.0523 followed by the $0.045 which is now below the white horizontal line. If XLM manages to establish a strong correction around this grey demand area, it could regain momentum to the $0.0738 resistance where the selling really happened yesterday, before climbing more to the $0.08 level. The resistance above this level is close to the $0.086 level where the major correction started a few weeks back.
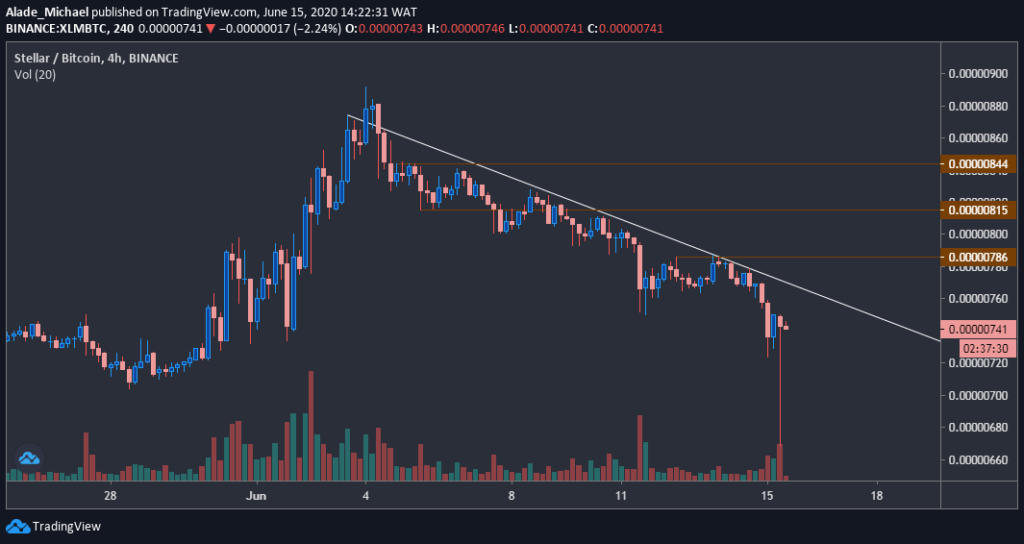
XLM loses 14% considering the new weekly close below the $0.075 so it is important to note that the bears are back on the market. The key resistance levels are set at 786 SAT, 815 SAT and 844 SAT while the key support levels are set at 700 SAT, 669 SAT, and 650 SAT. After the many rejections at the 1000 SAT level since 2019, Stellar’s price continued rolling back to the base support of 700 SAT over the past month.
The selloff was led by the recent price drop in bitcoin’s price below the $9000 level earlier today. In the meantime, the reversal candle seen on the 4-hour chart indicates temporary exhaustion in selling. A close above the white regression line, close to the 760 SAT could start a strong buy signal for the pair while Stellar could remain bearish if the white line continues forming.
DC Forecasts is a leader in many crypto news categories, striving for the highest journalistic standards and abiding by a strict set of editorial policies. If you are interested to offer your expertise or contribute to our news website, feel free to contact us at editor@dcforecasts.com


Discussion about this post