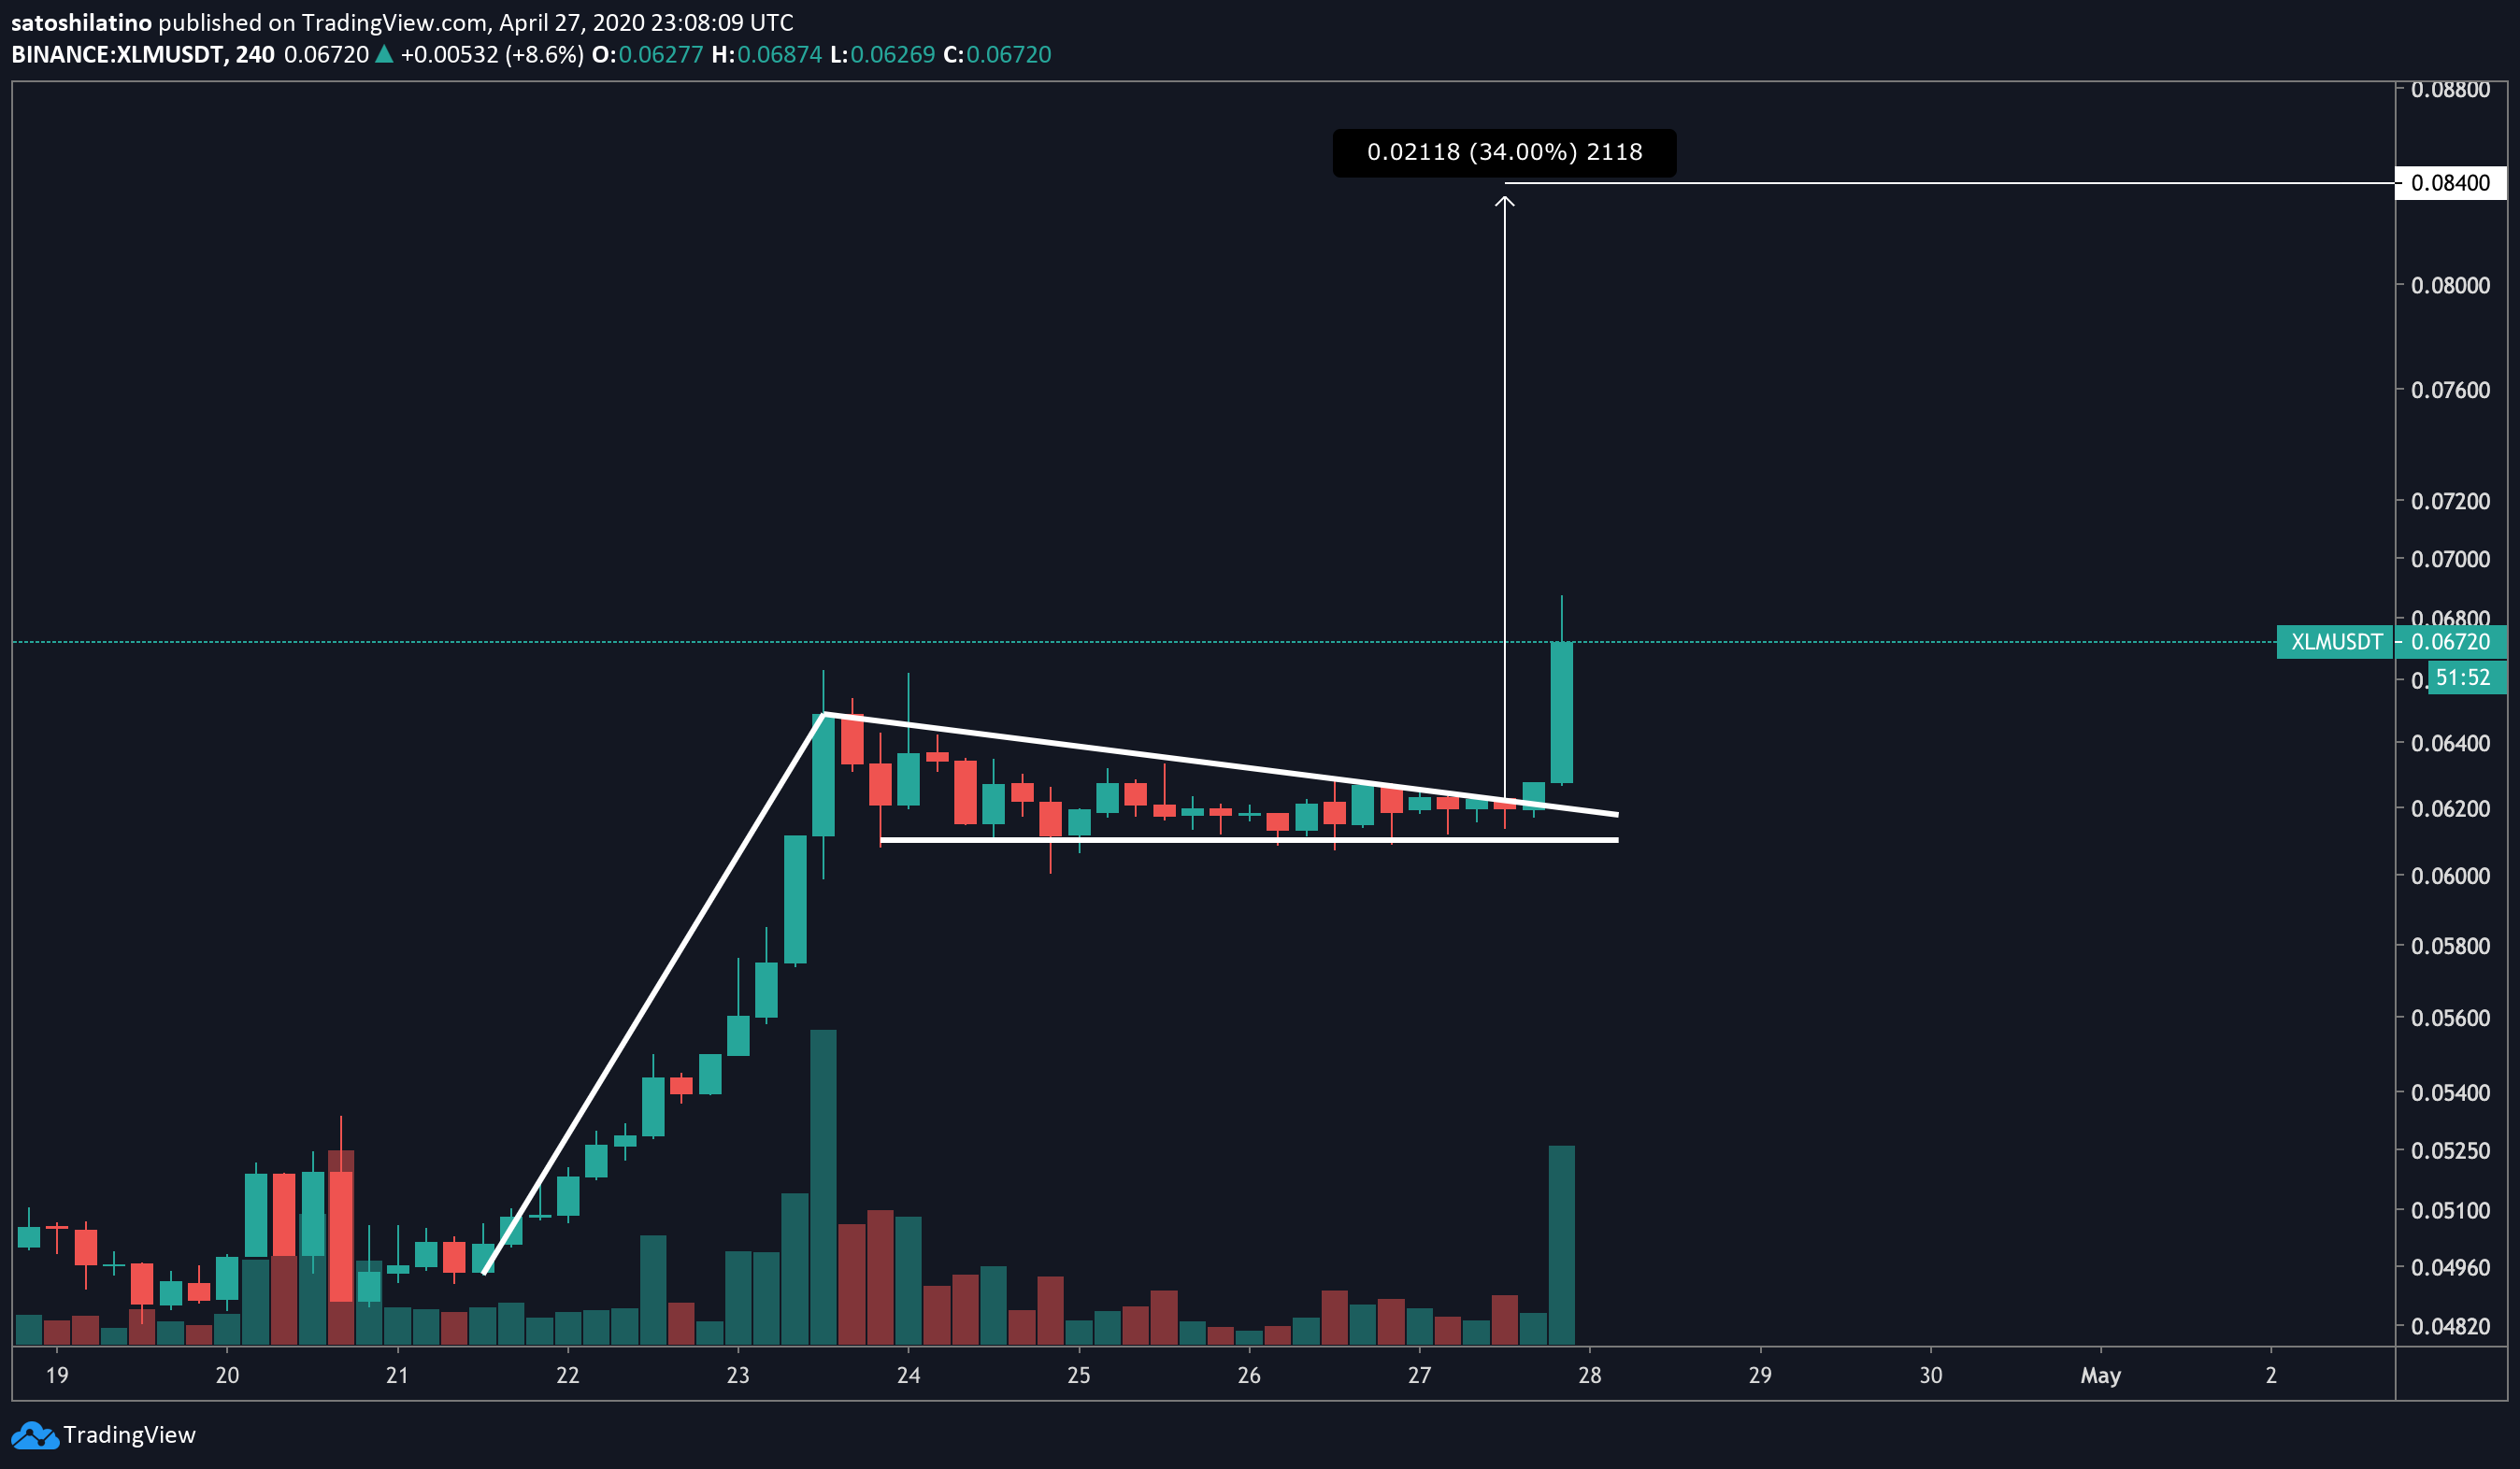
Stellar indicates where the price of the benchmark cryptocurrency is going next as it has become the leading indicator of the BTC price since April. In our latest Stellar lumens news, we can see that the altcoin increased by more than 18% since the low level of $0.059.
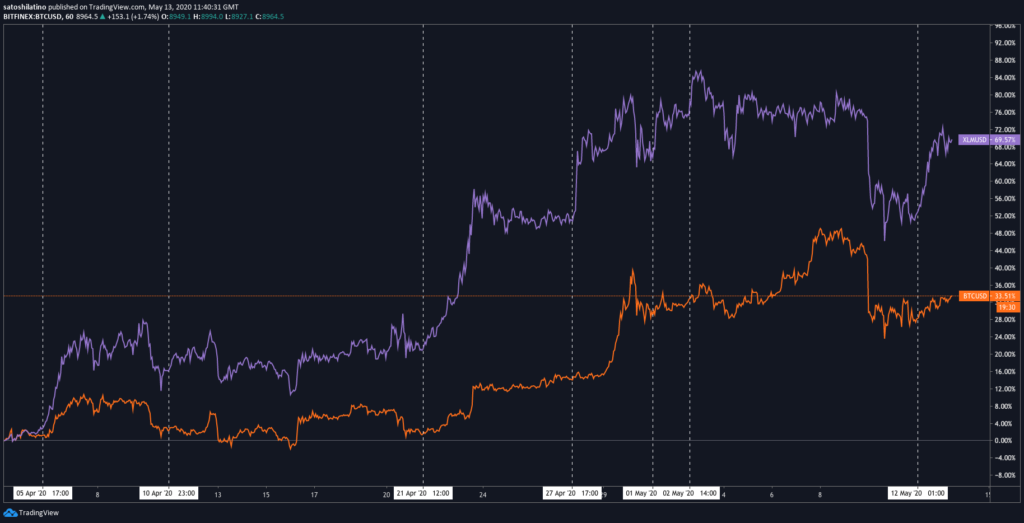
If the correlation with Bitcoin continues, the upswing in price could indicate that the number one cryptocurrency is bound for a bullish impulse. The increase in buying pressure behind Bitcoin could reach a new increased level to the $9,600. Stellar seems to have led some run-ups in the crypto market over the past 20 days. if the history repeats, Bitcoin could follow the XLM upward movement. Over the past few weeks, there was a unique correlation developing between Stellar and Bitcoin.

Each time that Stellar posted significant gains, Bitcoin followed later on. This was initially seen on April 5. The bullish momentum behind Stellar increased which led to a 7% upswing by the time Bitcoin started increasing. A few days later, the number one cryptocurrency started following the price of XLM which already increased by 5%. The same pattern developer three more times which only confirms that Stellar indicates the Bitcoin price action.
Stellar Lumens entered the upward impulse that was seen recovering from the recent losses that happened over the past weekend. The price action led to the formation of the buy signal based on the TD indicator. The bullish pattern developed in a red nine candlestick on the XLM 1-day charts. Another increase in buying pressure can validate the signal presented by the TD indicator. Within these circumstances, the cross-border transaction token could be bound to the one to four candlesticks or at the start of the new upward countdown.

The candlestick close to the 24% Fib retracement level will signal a move to the mid-February high of $0.09 while on the flip side, the 38% fib retracement level should hold for the uptrend. The recent history confirms that Stellar is leading the Bitcoin price and one can expect that Bitcoin could be able to break out sooner once XLM is up by 18% from the swing low. The Bollinger Bands on the BTC charts add credence to the bullish outlook as they begin to squeeze, we can expect higher volatility building up.
The candlestick above the 50% fib retracement level could be used as confirmation of the scenario. going past this resistance could see Bitcoin going to the next supply barriers around 38% and 23% Fib retracement levels.
DC Forecasts is a leader in many crypto news categories, striving for the highest journalistic standards and abiding by a strict set of editorial policies. If you are interested to offer your expertise or contribute to our news website, feel free to contact us at [email protected]


Discussion about this post