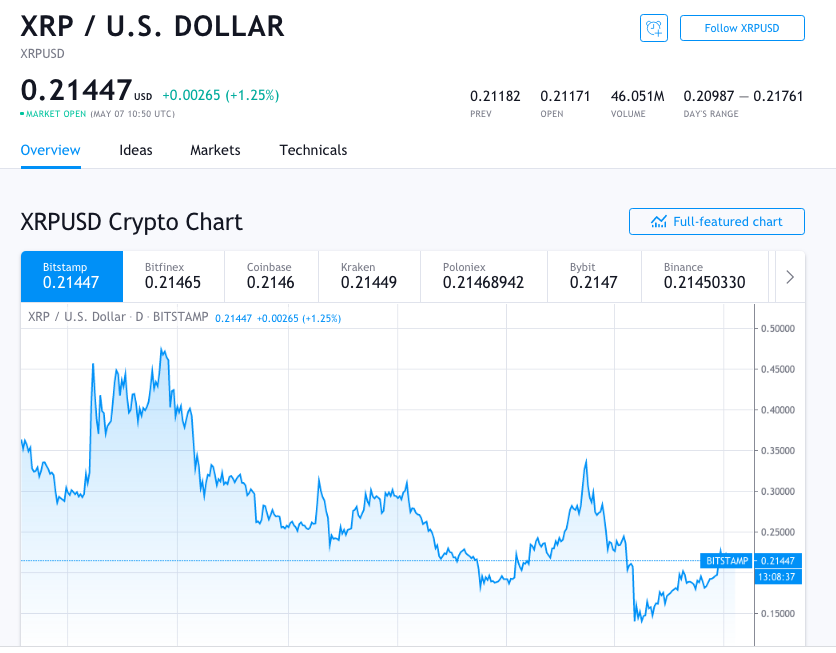
The XRP price shows signs of a reversal now, even though a rally as an option is still not excluded. The coin is showing bearish signs lately, but could start a fresh increase as long as it is above the 100 SMA.
We could notice that the Ripple price is currently struggling to stay above the $0.2100 support against the US dollar. There was a break recently below a key bullish trend line with support near $0.2160 on the 4-hours chart of the XRP/USD pair.
The pair must stay above the $0.2050 and the 100 SMA to start a fresh increase. Over the past month, the XRP price surged and the Ripple news showed that there is a lot of potential for this coin. The $0.2000 and $0.2100 resistance levels are here and the coin could move into a positive zone.
Trading as high as $0.2359, the coin settled well above the 100 simple moving average (4-hours) and recently started a new downside correction. We could notice a break for the XRP price below the $0.2200 support zone, and it declined below the 23.6% Fib retracement level of the upward move from the $0.1789 low to the $0.2359 high.
However, the $0.2100 region is acting as strong support now. The 50% Fib retracement level of the upward move from a $0.1789 low to a $0.2359 high is also acting as a support level. In the past few days, the XRP price shows signs of a reversal but is still trading in a broad range above $0.2100.
Therefore, the coin struggled to clear the $0.2250 resistance zone. We could also notice a downside reaction in the latest cryptocurrencies news, but the dominant coin BTC led altcoins to a new rally below a key bullish trend line with support near $0.2160 on the 4-hours chart of the XRP/USD pair.
The next major resistance is near the $0.2265, above which the bulls are very likely to aim at a larger upward move towards the $0.2350 and the $0.2420 levels. On the downside, there is a key support forming near $0.2100. The most important uptrend support is near the $0.2050 level and the 100 simple moving average.
The technical indicators for the Ripple price now look like the following:
- 4-Hours MACD – The MACD for XRP/USD is currently gaining momentum in the bearish zone.
- 4-Hours RSI (Relative Strength Index) – The RSI for XRP/USD is now below the 50 level, with bearish signs.
- Major Support Levels – $0.2100, $0.2070 and $0.2050.
- Major Resistance Levels – $0.2200, $0.2250 and $0.2350.
DC Forecasts is a leader in many crypto news categories, striving for the highest journalistic standards and abiding by a strict set of editorial policies. If you are interested to offer your expertise or contribute to our news website, feel free to contact us at editor@dcforecasts.com


Discussion about this post