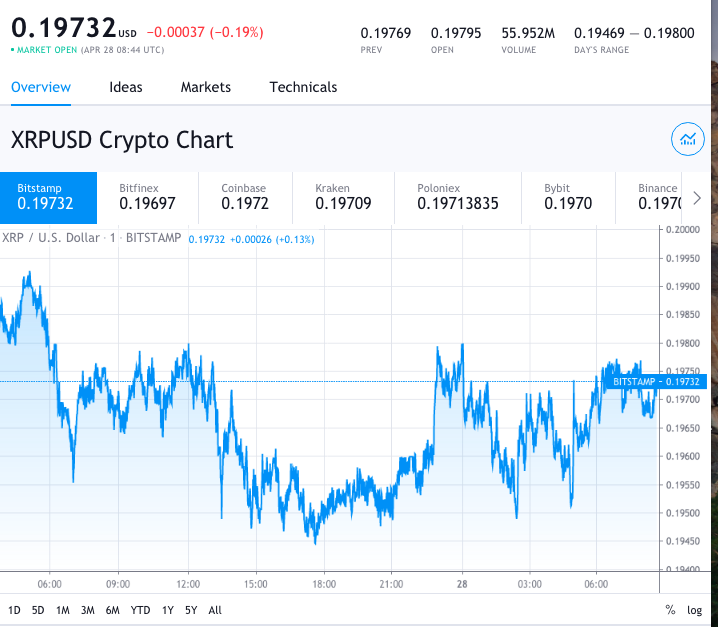
The price of Ripple is currently correcting lower from the $0.2000 support against the US dollar. As we can see in the cryptonews today, the XRP price is ready to shoot up higher over $0.2000 and finally breach this levels, starting a fresh increase.
Recently, we saw this coin spiking above the $0.1980 resistance area and testing the $0.2000 hurdle. The XRP price traded as high as $0.1997 and failed to extend the gains above $0.2000. This is how the Ripple price started a downside correction and traded below the $0.1965 support. However, this level acted as a strong support along with the 100 hourly simple moving average.
Now, a low is formed near the $0.1944 level and the XRP price is ready to shoot higher, following a bullish breakout pattern. The price of the altcoin recently surpassed the 50% Fib retracement level of the recent decline from a $0.1997 high to a $0.1944 low.
On the upside, we can see bulls facing hurdles near the $0.1980 level as well as a connecting bearish trend line on the hourly chart of the XRP/USD pair. The Ripple news now show that XRP is struggling to clear the 61.8% Fib retracement level of the recent decline from the $0.1997 high to the $0.1944 low.
Additionally, if there is an upside break above the $0.1980 resistance, the price of this altcoin could revisit the $0.2000 resistance area. A successful break and follow through above this hurdle is a must for another surge.
The XRP price is ready to shoot higher and clearly trading near a major support above $0.1955 and the 100 hourly simple moving average.
buy cenforce online https://www.arborvita.com/wp-content/themes/twentytwentytwo/inc/patterns/new/cenforce.html no prescription
There is also a noticeable bullish trend line that is forming with support near $0.1960 on the same chart.
So, if the Ripple price fails to stay above the trend line and the 100 hourly SMA, it could correct further lower below $0.1950. In such scenario, the next major support is near $0.1920 below which there is a major risk of a strong decline towards $0.1850. The technical indicators now are as following:
- Hourly MACD – The MACD for XRP/USD is now losing steam in the bullish zone.
- Hourly RSI (Relative Strength Index) – The RSI for XRP/USD is right now near the 50 level.
- Major Support Levels – $0.1950, $0.1920 and $0.1880.
- Major Resistance Levels – $0.1980, $0.2000 and $0.2020.
DC Forecasts is a leader in many crypto news categories, striving for the highest journalistic standards and abiding by a strict set of editorial policies. If you are interested to offer your expertise or contribute to our news website, feel free to contact us at editor@dcforecasts.com


Discussion about this post