XRP consolidated on the charts and was among the few coins that did it while BTC slid below the $30,000 price point which dampened the entire price action of altcoins so let’s have a closer look at today’s latest Ripple XRP news.
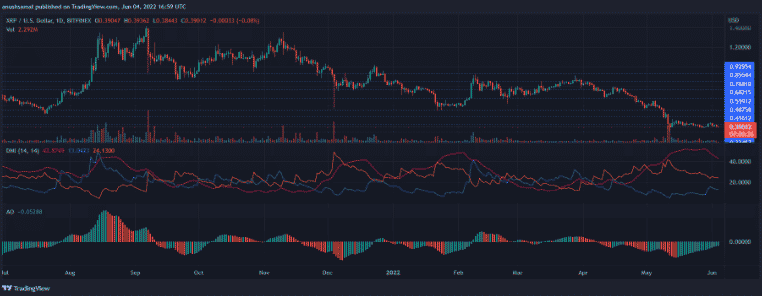
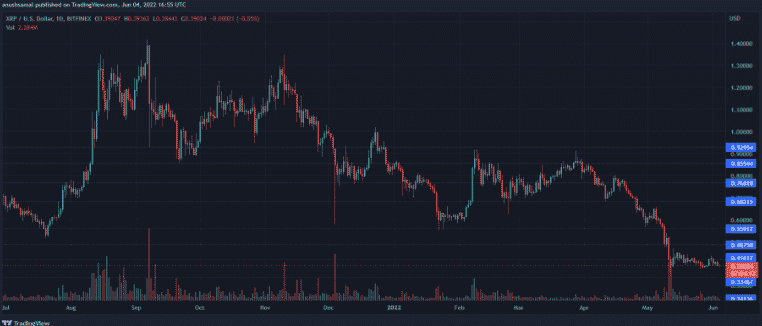
In the past 24 hours the altcoin only gained a minor 2.4% and on the chart, the coin displayed some bearish price action with the coin breaking the consolidation. XRP consolidated and found support at $0.34 and the coin touched this price level last back in February 2021 so if the coin pushes below further it could touch the support level of $0.28. The global crypto market cap was set at $1.28 trillion with a 0.7% positive change in the past day. If the bulls continued struggling to break past the $0.43 resistance, the coin could be headed for another downslide.

The coin was trading at $0.38 at the time of writing and the local support level for the coin stood at $0.33 so if the coin continues to get selling pressure, it can fall below this level and the overhead resistance stood at $0.40. for the bulls to be back, XRP has to break the price resistance and trade near $0.43 so the volume of XRP traded dropped as seen on the charts and the volume was seen in the charts that showed bearish significance in the market. The buying strength tried to rise on the chart but after the coin was oversold it recovered a little and at the time of writing, the RSI was in the oversold territory despite the selling pressure on the market.
buy amoxicillin online https://buynoprescriptionrxonline.net/dir/amoxicillin.html no prescription

The price of XRP was struggling to move above the 20-SMA line and the coin was still below this line which signifies that the bears can drive the price momentum in the market. In case the demand for the coin shows up, it can move above this line and even trade at $0.40. XRP could bottom out and aim for the next resistance level. The coin also showed a buying signal on the chart but the Awesome Oscillator depicted a price momentum and displayed a change in price momentum. The green signal bar was synonymous with the buying signal which means that a change in price action is happening. The DMI was also positive which corresponds with the AO and indicated a bullish build-up. The average Directional index was above the 40 mark and it was a mark of the price trend that is strengthening the market.
buy valtrex online https://buynoprescriptionrxonline.net/dir/valtrex.html no prescription
DC Forecasts is a leader in many crypto news categories, striving for the highest journalistic standards and abiding by a strict set of editorial policies. If you are interested to offer your expertise or contribute to our news website, feel free to contact us at editor@dcforecasts.com


Discussion about this post