XRP can reach $1 after increasing 25% in one week but a fractal from 2018 and 2019 showing up again could spell trouble for XRP’s long-term upside outlook as we are reading further in our latest Ripple news.
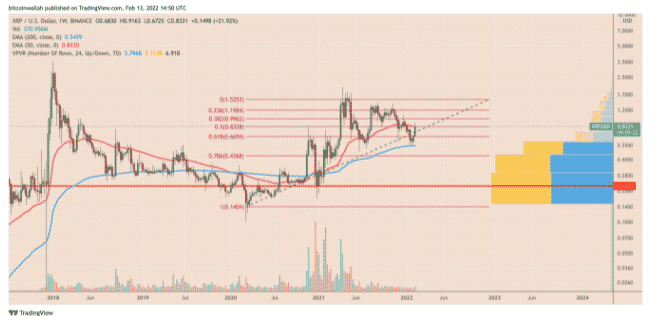
The XRP price continued to bounce back after falling by 70% in a correction that lasted for almost a year. The XRP/USD pair reached as high as $0.916 on February 13th above its 50-week exponential moving average of around $0.833. The upside move opened some chances for another bullish momentum owning to a historical buying sentiment around the same wave. For example, the traders had successfully reclaimed the 50-week EMA as support in the week ending July 27, 2020, for almost a year after flipping the wave as a resistance. Later, XRP’s price rallied by 820% to $1.98 back in 2021 its best level in more than three years.

During the bearish cycles between 2018 and 2020, XRP’s 50-week EMA acted as a strong resistance level on a few occasions whcih showed the wave’s ability to withstand bullish recovery sentiments like the one seen in the current price rebound. XRP can reach $1 after increasing 25% and now it hols decisively above the 50-week EMA which could maintain the price level ahead. This level that sits around 25% above the current price levels, coincides with XRP’s two key resistance targets with the first one being a multi-month downward sloping trendline which has been capping the token’s upside bias since 2021.
In the meantime, the second target is the 0.382 FIB line of the Fib retracement level drawn between $2.70 swing high to the $0.10 low while having a history of limiting XRP’s strong trends by acting as support or resistance. Still a lower high but the $1 level doesn’t promise to take XRP out of the correction bias but it could bring opportunities for traders to secure their interim profits which will expose XRP to a pullback towards an imminent support target near $0.71 according to the Fibonacci retracement graph. Filing to obtain a decisive close above the 50-week EMA resistance could have XRP eye a new pullback towards its 200-week EMA close to the $0.54 level.

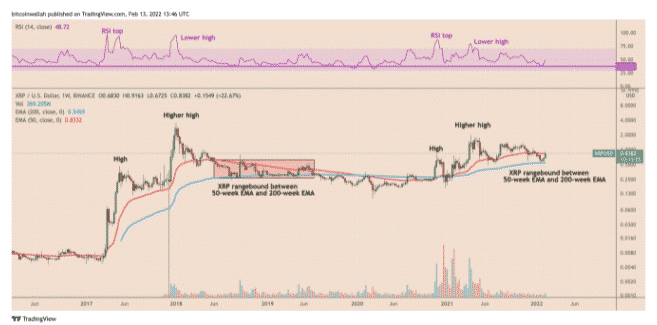
This move can trap the price inside a range defined by 50-week EMA as the resistance and 200-week EMA as support which could result in a further breakout to the downside with the bearish outlook appearing out of a fractal from 2018 June 2019 session. XRP’s run to a new high in 2018 coincided with a weekly relative strength index that formed a lower high and confirmed the bearish divergence.
DC Forecasts is a leader in many crypto news categories, striving for the highest journalistic standards and abiding by a strict set of editorial policies. If you are interested to offer your expertise or contribute to our news website, feel free to contact us at editor@dcforecasts.com


Discussion about this post