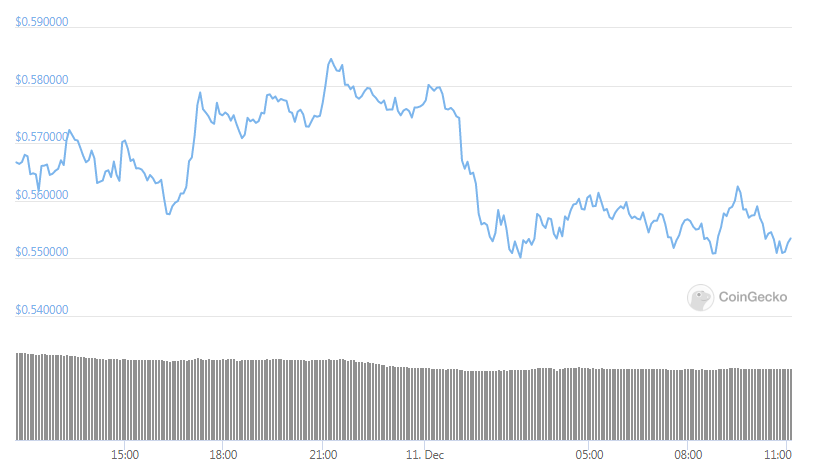
The XRP bearish signs signal a new continuation of the downtrend below $0.55 as it is struggling to clear the $0.5800 resistance against the US dollar. The price is now showing more bearish signs and it could speed lower below $0.5420 so let’s find out more in today’s Ripple price news.
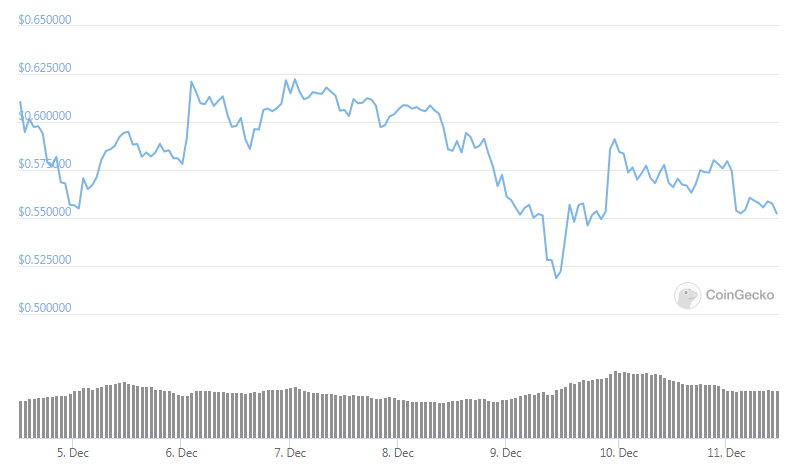
Ripple topped above the $0.6000 level before starting a new decline against the US dollar. The price is now trading well below the $0.5680 level support and the 100 hourly simple moving average with a key bearish trend line forming with the resistance at $0.5800 on the hourly charts of the pair. The pair will continue lower if there’s a clear break below $0.5500 and $0.5420.

Over the past 2-3 sessions, there were some bearish movements in ETH, BTC and XRP against the US dollar with ripple’s price forming a high at $0.6059 before it started a new decline. There was a clear break below the $0.5800 level with a key bearish trend line forming with resistance at $0.5800 on the hourly charts of the pair. The pair even traded below that support and settled below the 100 hourly simple moving average.
buy kamagra soft generic buy kamagra soft online no prescription
It spiked below the 50% fib retracement level from the upward movement at $0.5024 swing low to the $0.6059 high. The immediate support on the downside is near the $0.550 level with the key support nearing the $0.5420 level. It is close to the 61.8% fib retracement level of the upward movement from the $0.5024 swing low to a $0.6059 high. A close below the $0.5500 and the $0.5420 support levels could start a new decline in the upcoming sessions so there’s a risk of dropping towards the $0.5200 support or even $0.5100.

If there’s no downside break in XRP’s price below the $0.5420 support, it could start a decent rise with an initial resistance on the upside getting close to the $0.5650 level with the major resistance nearing the $0.5720 level. The XRP bearish signs signal a new bearish trend line forming at $0.5800 and the 100 hourly simple moving average. A close above the $0.5800 level will start a strong increase to the $0.6000 and $0.6120 level in the near-term.
The technical indicators show that the MACD for the pair is gaining momentum in the bearish zone with the hourly RSI being well below the 50 level. some major support levels include $0.5500 and $0.5420 while the major technical levels include $0.5650 and $5700.
DC Forecasts is a leader in many crypto news categories, striving for the highest journalistic standards and abiding by a strict set of editorial policies. If you are interested to offer your expertise or contribute to our news website, feel free to contact us at [email protected]


Discussion about this post