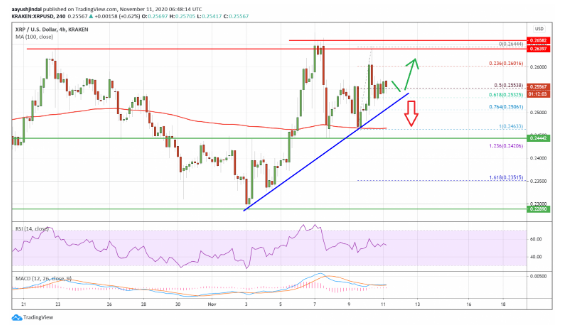
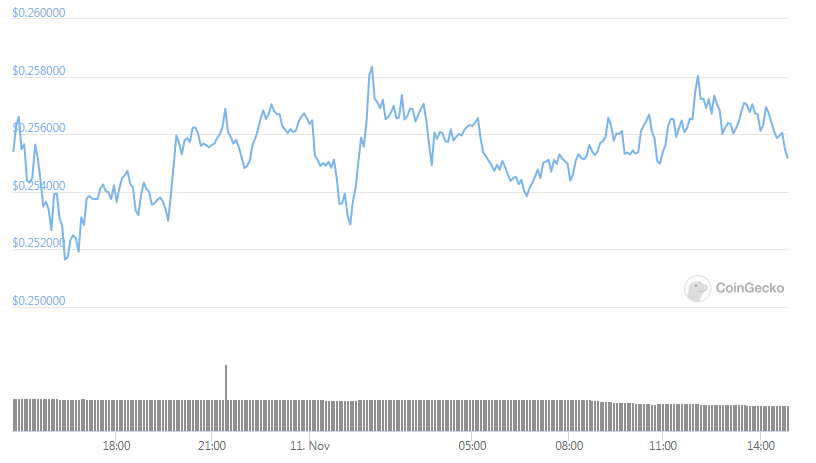
The Ripple vulnerabilities remain open as XRP struggles below $0.26 as it failed on more than two occasions near the $0.2600 and the $0.2640 against the US dollar. The price could nosedive further if there is a break below the $0.2500 support so let’s look into the Ripple XRP news some more.
Ripple traded as high as $0.2644 and corrected lower against the US dollar. The price is trading well above the $0.2500 support level and the 100 simple moving average with a crucial bullish trend line forming with support of $0.2515 on the 4-hours chart of the pair. The XRP/USD pair could start a strong rally if it clears the $0.2600 and the $0.2640 levels in the near-term. After finding the bids bear the $0.2440 and the $0.2450 support level, Ripple’s XRP price started increasing. The price broke the $0.2500 resistance level and settled well above the 100 simple moving average. It even broke the $0.2600 resistance level but the bulls are still struggling to gain strength above the $0.2600 and the $2640 resistance levels. The swing high was formed close to $0.2644 before the price started a downside correction.

There was a break below the $0.2550 level and the price even traded below the 50% fib retracement level from the recent upward movement at the $0.2463 low to the $0.2644 high. The decline found support close to the $0.2500 zone while the Ripple vulnerabilities remain open.
buy finasteride online www.parkviewortho.com/wp-content/languages/new/prescription/finasteride.html no prescription
The Fib retracement level from the recent upward movement from $0.2463 low to $0.2644 high is acting as a support. What’s even more important there’s a crucial bullish trend line forming with support of $0.2515 on the 4-hour charts of the XRP/USD pair. on the upside, the price is facing a huge resistance close to $0.2600 and $0.2640. If there’s a successful break above the $0.2640 resistance zone, the price could start a strong rally. The next resistance could be close to $0.2720.

If Ripple fails to clear the $0.2600 and the $0.2640 resistance levels, there’s a risk of a bearish breakdown. The first key support is near the trend line and the $0.2500 level. the next major support is close to the $0.2460 level and the 100 simple moving average. Below this level, the price could dive towards $0.2300 support. The MACD for the pair is moving into the bullish zone while the 4-hour RSI for the pair is well above 50.
DC Forecasts is a leader in many crypto news categories, striving for the highest journalistic standards and abiding by a strict set of editorial policies. If you are interested to offer your expertise or contribute to our news website, feel free to contact us at [email protected]


Discussion about this post