Ripple starts a sharp downside correction to $0.63 as it failed to clear the $0.6800 resistance against the US dollar. The price is now showing bearish signs below the 100 hourly SMA and is now facing many hurdles so let’s read more in the latest ripple XRP price news today.
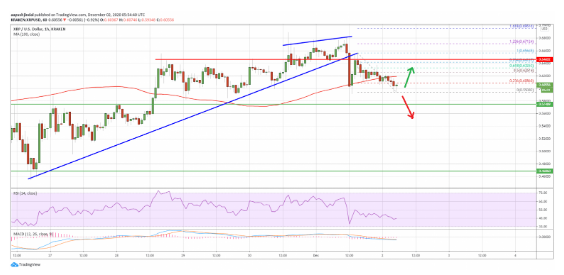
Ripple starts sharp downside to the $0.63 level as it is now trading below it. XRP broke a major bullish trend line with the support near the $6460 level on the hourly charts of the pair which is likely to continue lower unless it surpasses the $0.6300 and the 100 hourly SMA level. There was also a sharp bearish reaction in BTC and ETH as well as XRP against the US dollar. XRP’s price broke the $0.6450 support zone into the short-term bearish zone and the price gained pace after the break below of the bullish trend line with the support seta t $0.6460. The pair settled below the $0.6300 and the 100 hourly simple moving average.

There was a spike below the $0.6000 support but the XRP price remained stable above $0.5800. The recent price swings formed near $0.5938 and the price is now consolidating. The initial resistance is near the $0.6080 level with a close of the 23.6% fib retracement level of the downward movement near the $0.6564 swing high to $0.5938 low. The first major resistance is near the The first major resistance is near the $0..
buy prelone UK https://www.calmandgentledentalcare.co.uk/wp-content/languages/new/prelone.html no prescription
6200 level and the 100 hourly simple moving average. The next resistance is near the $0.6250 level or the 50% fib retracement level from the downward movement at the $0.6564 swing high to the $0.5938 swing low. Braking above these levels could clear the path for more upsides to the $0.6550 level.

If there’s no upside break in Ripple above the $0.6300 level, there could be more losses. Initial support on the downside is close to the $0.600 level and the next key support forming near the $0.5920 level is a zone where the price could revisit and start sliding to $0.5750. More losses could lead the price to the $0.5200 level. The technical indicators for the pair like the MaCD are in the bearish zone while the RSI is now below the 50 levels. The major support levels are set at $0.6000 and the $0.5920 level with the major resistance levels are set at $0.6250 and $0.6300.
DC Forecasts is a leader in many crypto news categories, striving for the highest journalistic standards and abiding by a strict set of editorial policies. If you are interested to offer your expertise or contribute to our news website, feel free to contact us at [email protected]


Discussion about this post