Ethereum slipped again and in the past week, it lost about 10% of its value. The bears enhanced their position on the market because the buyers left the market so what’s the next trading level? Let’s find out more today in our latest Ethereum news.
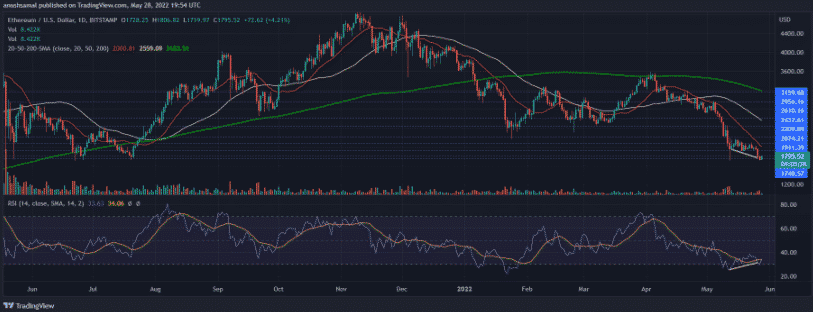
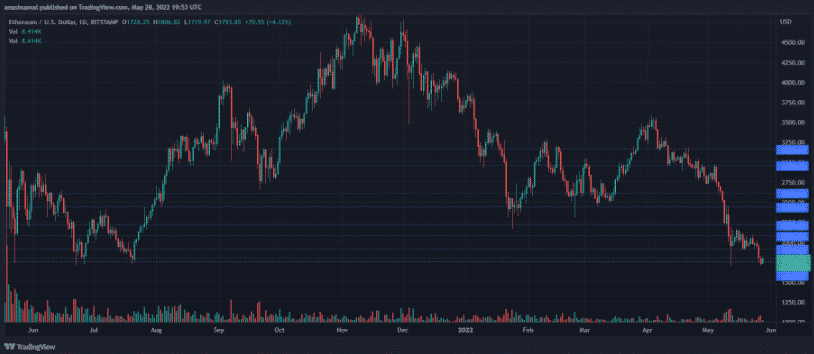
The technical outlook of the coin remained bearish and the selling pressure increased. The coin continued to remain strong in the next trading sessions. The coin witnessed a sustained sell-off over the past 48 hours and ETH fell below the long-standing support of $1900. in the past day, the coin tried to recover but the bearish price action was still strogn at the time of writing. The bears are seeing an exert in pressure to push the coins below the $1700 price point.

Ethereum slipped again and below the $1700 price point will cause ETH to crash by another 19%. for the bulls to slow down, ETH needs to trade above $1900 and the altcoin was priced at $1793 so the altcoin hasn’t traded near this price in a year now and the overhead resistance stood at $1900 for the bearish pressure to be invalidated with the coin trying to trade above the $2200. The local support for the coin was set at $1700 which the coin could trade below if the bears continue to drive the price action so the volume of the coin traded decreased and entered the green whcih posed a green level on the charts.
Ethereum was trading close to the immediate support level so the coin was trading below the 20-SMA line which meant the selling momentum was strong. The reading meant sellers were in charge of the price momentum but with correspondence with the same, the RSI was below the half-line. This meant that the buying strength was less in the market but it can be noted that there’s an uptick in the RSI which can be a sign that buying strength which picks up momentum. The chances of a reversal cannot be ruled out because there’s a bullish divergence on the charts which is related to a trend reversal.

The Awesome Oscillator was negative on the one-day chart and it is supposed to depict the price momentum in the red, negative price action. The red charts depict a sell signal on the chart.
DC Forecasts is a leader in many crypto news categories, striving for the highest journalistic standards and abiding by a strict set of editorial policies. If you are interested to offer your expertise or contribute to our news website, feel free to contact us at editor@dcforecasts.com


Discussion about this post