The ETH Steady price action moved the coin towards the $500 price range before the bulls appeared near the $480 against the US dollar. The price corrected higher but it will likely start a strong resistance near the $550 and the 100 hourly SMA so let’s read more in the latest ethereum price news.
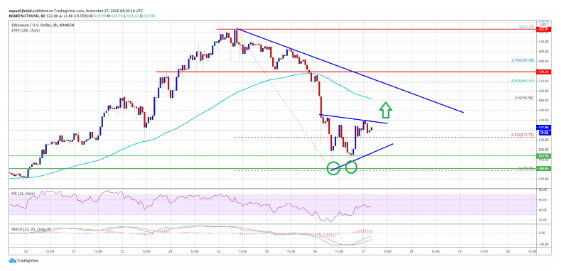
Ethereum started an upside correction after it formed strong support at $480. The price faced a strong resistance close to the $550 and the 100 hourly simple moving average with a short-term contracting triangle forming with the resistance at $528 on the hourly charts of the pair. The pair could test the $550 resistance if it manages to the triangle resistance zone. There was a sharp decline in BTC and ETH, Ripple, and other altcoins. The coin broke the $550 support level and settled below the 100 hourly simple moving average and now the ETH steady price action moves the coin towards $500.

The price movement opened the doors for more downsides and the price spiked below $500. ETH then found a support zone near the $480 level with the bears making two attempts to clear the $480 support but they failed to do so. The price started a strong recovery wave above the $500 level. There was a break above the $510 resistance level as the coin climbed above the 23.6% Fib retracement level from the recent decline at $623 swing high to the $478 low. looking at the upside, there’s a major hurdle forming close to the $550 level and the 100 hourly simple moving average. There’s also a short-term contracting triangle forming with the resistance close to the $528 on the charts of the ETH/USD pair.

If there’s an upside break above the triangle resistance, ETH could test the $550 level and it is close to the 50% fib retracement level from the decline at $623 swing high to the $478 low. The move into the positive zone, the price has to clear the $550 resistance and will likely settle above the 100 hourly SMA. If ETH fails to recover above the $550 level, there will be a fresh decline with the initial support is close to the $510 level and the triangle lower trend line. The downside break below the triangle support will push the price below the $500 level with the main support nearing the $480 level below which there’s a risk of a drop to the $450 level. The hourly MACD for the pair is losing momentum in the bullish zone while the RSI for the pair is closing to the 50 level.
DC Forecasts is a leader in many crypto news categories, striving for the highest journalistic standards and abiding by a strict set of editorial policies. If you are interested to offer your expertise or contribute to our news website, feel free to contact us at editor@dcforecasts.com


Discussion about this post