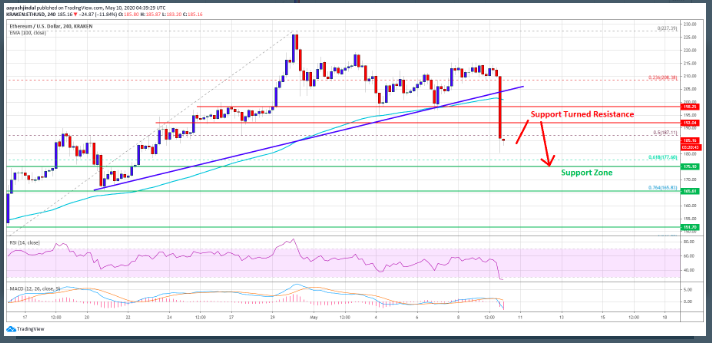
As we can see from the latest Bitcoin and altcoin news, the entire markets crashed yesterday – and the leading altcoin Ethereum is now in a bad position after it lost more than 9% overnight. The market data shows that the ETH price is risking a new pullback to $175 if the drop extends – and ETH is gaining bearish momentum ever since it broke the key $200 support zone against the US dollar.
Currently, the ETH price is risking a lot as it is trading below $192 and the 100 simple moving average (4 hours). There was a break below a key bullish trend line with support near $205 on the 4-hours chart of the ETH/USD pair.
The past week, Ethereum made many attempts to gain bullish momentum and go above the $210 resistance area – just like BTC did with the $10.000 mark – but it failed. The ETH price formed a local top near the $215 level and started a strong decline after it.
The recent decline in Bitcoin below the $9,000 support sparked a heavy bearish move all over the markets, and the ETH price is risking to fall to $175 which is where some analysts pinpoint the current support levels.
In the other crypto news, we can see that the ETH/USD pair settled below the $192 support and the 100 simple moving average. It is now trading below the 50% Fib retracement level of the upward move from $146 as its low to the $227 as its high.
The first key support is now seen near the $175 level. It represents the previous breakout zone and coincides with the 61.8% Fib retracement level of the upward move from the $146 low. However, the ETH price is risking of falling again and if it falls below $175, the $165 and $162 are the support levels in the near term.
The upsides are capped and if Ethereum wants to start an upside correction, we need to see immediate resistance near the $192 level. The first major resistance for buyers is seen near the $200 zone (which is also the recent breakdown zone). Anyways, the 100 simple moving average (on 4 hours) is also near the $200 level, acting as a crucial hurdle.
#ETH looks weak but a few random #Alts pumping every other day now. Today #XVG @vergecurrency doing it's thing. pic.twitter.com/6vtgfXHc9q
— Oslo Underground (@OsloCrypto) May 7, 2020
A successful close above the $200 level and the 100 SMA is needed for a fresh uptrend. The technical indicators now look as following:
- 4 hours MACD – The MACD for ETH/USD is now building momentum in the bearish zone.
- 4 hours RSI – The RSI for ETH/USD is right now near the oversold zone at 26.
- Major Support Level – $175
- Major Resistance Level – $200
DC Forecasts is a leader in many crypto news categories, striving for the highest journalistic standards and abiding by a strict set of editorial policies. If you are interested to offer your expertise or contribute to our news website, feel free to contact us at editor@dcforecasts.com


Discussion about this post