The Cosmos token hits a 50% increase but the near-term technicals spell trouble for the altcoin as it was trending upward for the past few days while the on-chain metrics show the prices could soon retrace. In our latest cosmos news today, we are reading more about the price analysis.
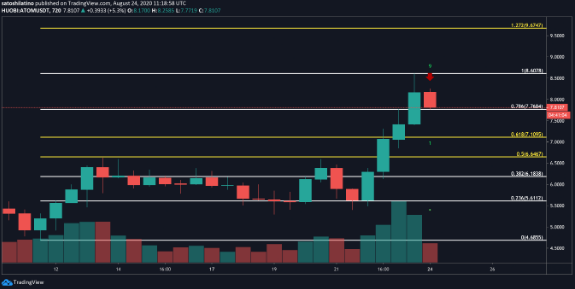
Some retail investors grew overwhelmingly bullish about Cosmos and its price action. The Cosmos token increased 50% in the past three days reaching new all-time highs. Despite the upswing, the technical metrics suggest a pullback is coming soon. The interoperable blockchain network Cosmos was on a roll lately as Atom hit a new all-time high. However, there are different metrics that suggest that the cryptocurrency is poised to retrace before continuing its uptrend.

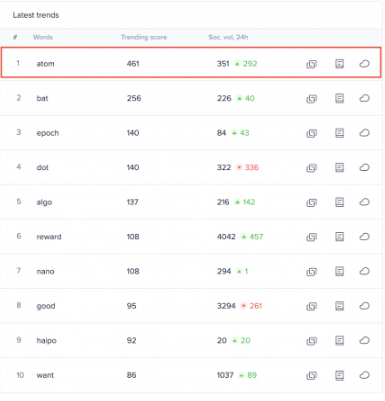
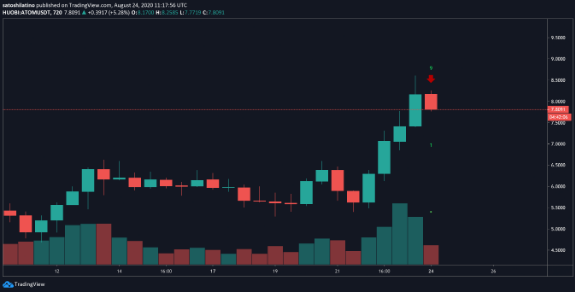
Cosmos captured the market’s attention over the weekend after the impressive upswing which saw the token hit an all-time high. Atom’s price increased by 50% in the past three days and outperformed some of the top cryptocurrencies by market cap. It started at $5.60 but it reached $8.6 for the first time. Alongside prices, the data reveals that the number of ATOM-related mentions on social media networks exploded. The altcoin’s social engagement increased by 5x and the increasing chatter around COSMOS allowed it to move to the first spot on Santiment’s Emerging trends list.

The high levels of notoriety are not necessarily a good sign in the short-term price action. When the prices jump usually, the crowd pays increased attention, and the token drops shortly after. The head of content and SEO at Santiment Dino Ibisbegovic maintained that after one cryptocurrency claims one of the three positions on the list, the prices fall by 8%. Increased crowd attention can be considered as a strong factor in price slumps.

The TD sequential index added credence to the bearish outlook as it is currently presenting a selling signal in the form of a green nine candlestick. The spike in sell orders could also validate the bearish formation suggesting a one to four candlestick correction before the uptrend resumes. The historical data shows that the TD setup was incredibly accurate at anticipating the local tops on the trend. Looking at the charts, there are about 8 selling signals presented since the start of the year. the current pessimistic view has to be taken into consideration.
DC Forecasts is a leader in many crypto news categories, striving for the highest journalistic standards and abiding by a strict set of editorial policies. If you are interested to offer your expertise or contribute to our news website, feel free to contact us at editor@dcforecasts.com


Discussion about this post