The oracle token LINK retraces after hitting a new all-time high but the data shows that there will be even more severe price slump soon so let’s take a look at the price analysis in the latest Chainlink news.
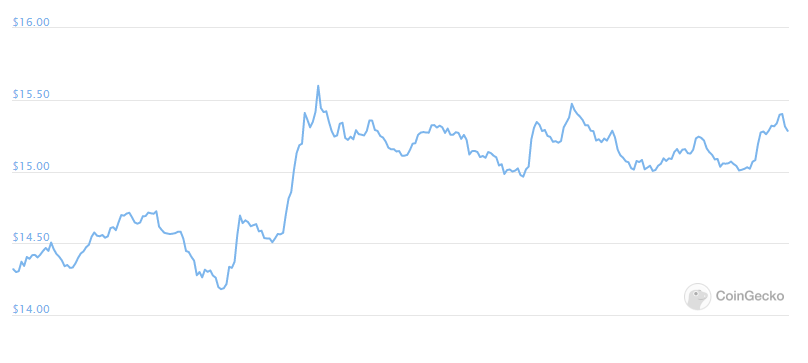
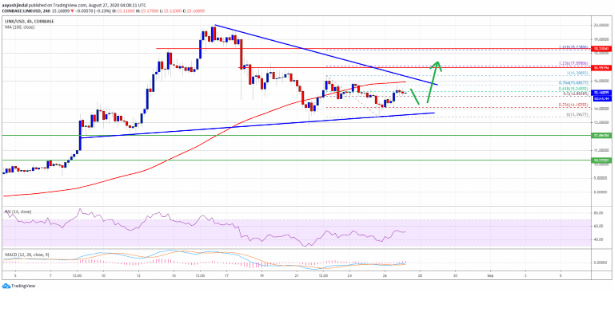
The oracle token LINK retraces by 36% after surging to an all-time high of $20 and the prices were then able to recover partially but the multiple on-chain metrics spell trouble. Breaking through the $14.4 support level we could see that the asset will fall further towards $11. Chainlink was consolidating within a narrow trading range in the past week but the technical indexes call for a rebound to the recent all-time high as the multiple on-chain metrics suggest a strong downward pressure on the cards.

Chainlink went over a major correction after surging more than 157% over the first half of August. The bearish impulse saw the decentralized oracle token drop by more than 36%. LINK went from trading at an all-time high of $20 to a low of $12.8. While the prices have recovered partially since then, it was not until the TD sequential indicator drew a buying signal on the cryptocurrency’s daily chart. The bullish formation created a red nine candlestick that transitioned into the green one due to the upward price action. The technical index estimated a one to four daily candlestick upswing. The IOMAP model suggests that chainlink will consolidate for a longer period of time.
The fundamental metric shows that there’s a critical resistance level ahead of the cross-chain data oracle token which could surge prices at bay. Based on the model, more than 6000 addresses had purchased more than 21 million tokens between $15.8 and $16.2. A huge supply barrier could have the ability to absorb more pressure. If the prices surpass this level, holders that were underwater will break even on their positions and will prevent prices from climbing further.

Regardless of the outlook, the IOMAP presents a bearish trend forming. The data from Glassnode shows that the number of new daily addresses is created on the network and it was declining since mid-August. This downward trend in the network growth which can be considered a negative signal based on the data, it regards as a leading price indicator. The decrease in user adoption over time can help the observers understand the health of the crypto network.
DC Forecasts is a leader in many crypto news categories, striving for the highest journalistic standards and abiding by a strict set of editorial policies. If you are interested to offer your expertise or contribute to our news website, feel free to contact us at [email protected]


Discussion about this post