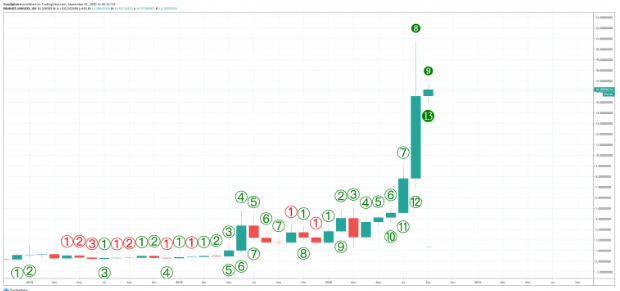
The LINK monthly results show that there could be some major selling signs upcoming as Chainlink was the biggest success story on the market since 2017. This year alone, the altcoin increased over 700% as we reported in the chain link news crypto.
From the lows to the highs of more than 1200%, LINK’s market cap also increased to as large as Tether and Ripple. After such a rally, it could be the situation that the bigger it gets, the harder it will fall especially since the LINK/USD pair initiated two selling signals on the monthly timeframe. With the August 2020 close, the LINK monthly results show that a candle has begun. The TD Sequential indicator shows each candle as another step in the sequence and when a series of candle closes follows a specific sequence as the indicator provides a setup signal.

If the sequence fails to complete the 9 count, the series will start again. The 9 count is just one type of sell setup with a 13-candle countdown. When these selling signs appear, it shows that the trend is near exhaustion and that a reversal could follow right after. The tool was used over the entire crypto and traditional financial market to precisely time tops and bottoms. A lot more weight is given to each signal depending on the signal timeframe so a TD 9 sell on the charts is not impactful as a sell signal on the daily charts.
Chainlink which was considered an unstoppable cryptocurrency started two of these huge signals on one of the highest timeframes possible. The September monthly candle open for the pair triggered a 9 and 13 sell setup on the TD Sequential Indicator and this tool has almost always called every major Bitcoin top and bottom. Because the signal appears on the way up, this could be seen as the peak of a parabolic climb as the signal hints downsides, not a continuation. Whether or not a reversal will come, it remains to be seen.

After the substantial increase over the short period, it is not uncommon for the cryptocurrencies to over-correct. Bitcoin was one example as it touched $20,000 and then crashed by more than 80% according to the parabola laws. Analysts such as Peter Brant said that the collapse was based on past statistics alone from when other assets retrace. There’s no denying that Chainlink went parabolic and into price discovery mode.
DC Forecasts is a leader in many crypto news categories, striving for the highest journalistic standards and abiding by a strict set of editorial policies. If you are interested to offer your expertise or contribute to our news website, feel free to contact us at [email protected]


Discussion about this post