The Chainlink indexes show that the asset is ready to retest the all-time highs as the on-chain and technical indicators signal a resuming of the trend. In today’s LINK news, we take a closer look at the price action of the asset.
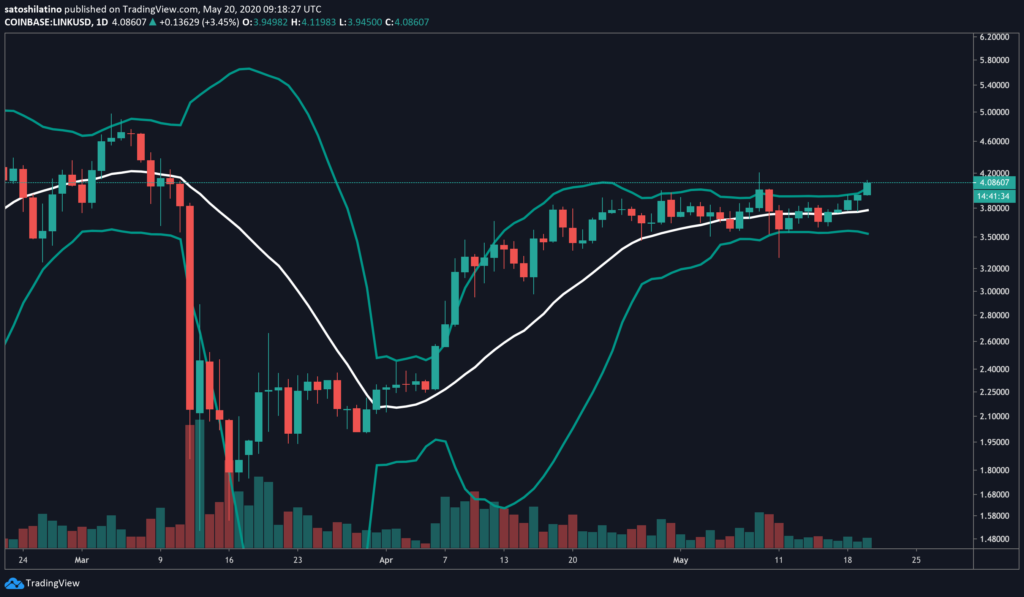
The decentralized oracles token was consolidating in a narrow trading range for the past month and all throughout the time, a bullish momentum was building up. An increase in the purchase pressure behind LINK could see it rise to the early-March high of $5 level. With the Bitcoin halving having passed, the investors grew optimistic about the future of crypto. Different altcoins such as Chainlink seem to be on the verge of a bullish breakout. The decentralized oracle token was consolidating in a narrow trading range over the past month while the stagnation phase between $3.6 led the Bollinger bands to press on the 1-day charts of LINK.

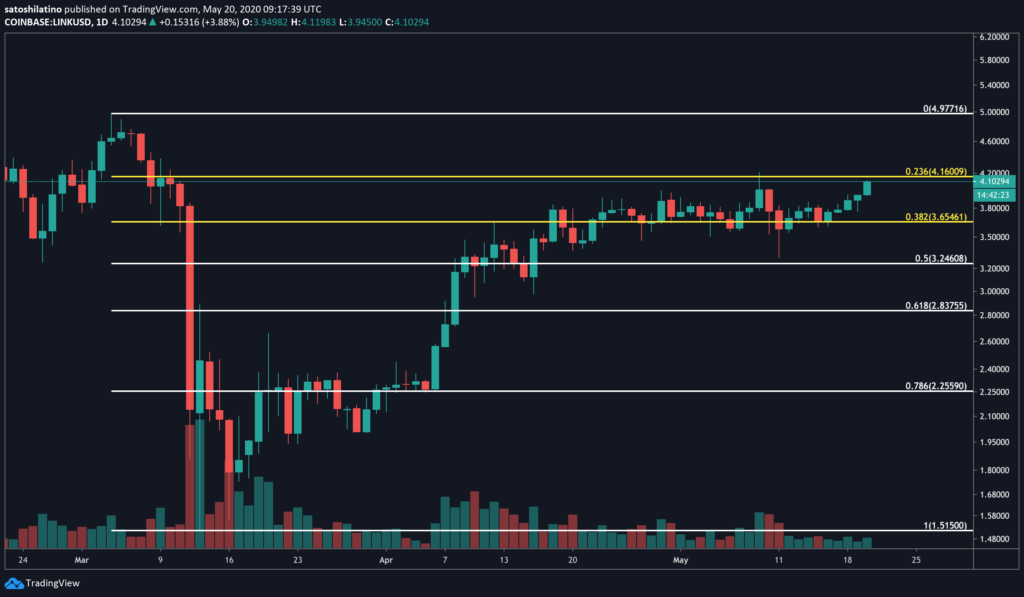
The Chainlink indexes show periods of low volatility which are usually followed by wild price movements. The longer the pressure the higher the probability of another major breakout. One technical index didn’t necessarily indicate whether Chainlink will go up or down but the area between the lower and upper band is at a no-trading zone. The candlestick closes below this area will help determine the direction of the trend. Based on the Fib retracement indicator, the no-trading zone is defined by the 38% level and the support and resistance levels sit on the $3.7 and $4.2 respectively.

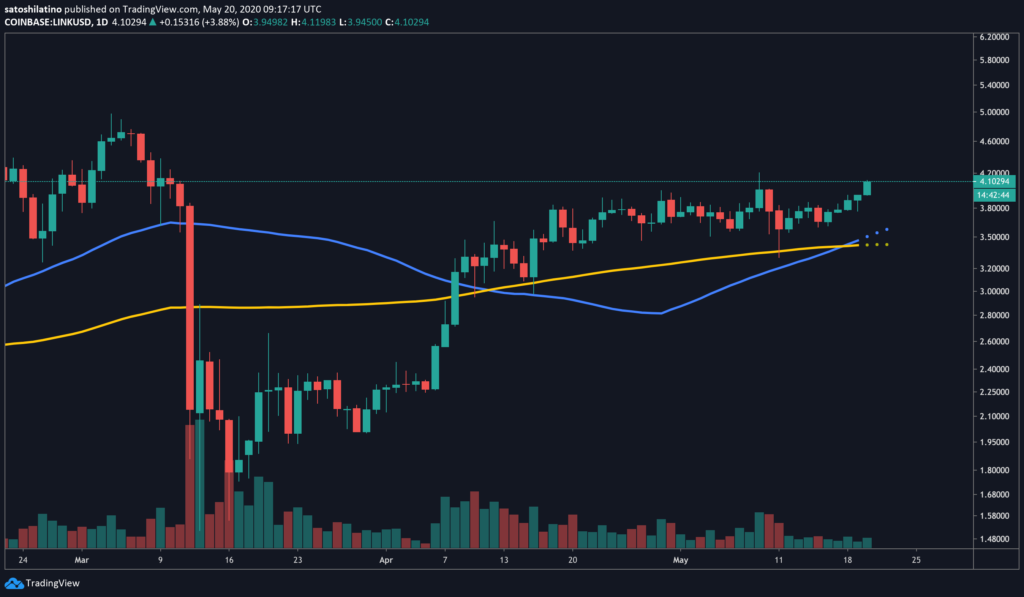
An increase in the selling pressure behind Chainlink will boost LINK past the support but the altcoin could later fall to the 50% or 61% Fib level. Also, if the demand picks up, LINK could test the swing high of $5. Despite all said before, there are several technical indexes that show a higher probability of LINK breaking out in an upward direction. The technical patterns developing in the 50-day moving average, moved above the 100-day moving average and some analysts even say that this pattern is one of the clearest buy signals that could start the bullish market.

The last time these moving averages formed a golden cross on the charts, was back in 2019 and early 2020. After these bullish formations, LINK surged by 25 percent and 60% in February. Now, something similar could happen. In addition to the golden cross, the moving average convergence divergence added credence to the optimistic outlook.
DC Forecasts is a leader in many crypto news categories, striving for the highest journalistic standards and abiding by a strict set of editorial policies. If you are interested to offer your expertise or contribute to our news website, feel free to contact us at [email protected]


Discussion about this post