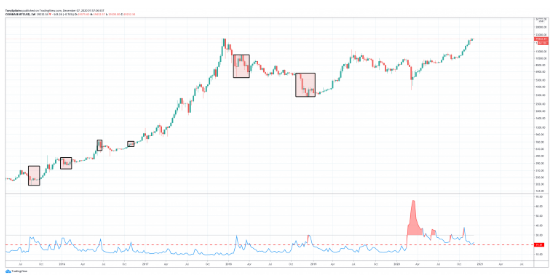
The VIX volatility index forecasted a major Bitcoin crash as the price is consolidating below the $20,000 level as we are about to see more in the latest Bitcoin news.
With the last confrontation at $10,000, it showed that the consolidation below this resistance is usually a typical bullish event. However, with the strong resistance above it, the uncertainty around the pandemic, the coming vaccine, and with the elections in the United States, there’s a strong chance of rejection as well.
buy wellbutrin online www.adentalcare.com/wp-content/themes/medicare/editor-buttons/images/en/wellbutrin.html no prescription
While the signals are mixed and analysts divided, the VIX volatility index will be a major warning for an extremely volatile drop to come.

The crypto market is confused at the moment with the chaotic capitulation since the Black Thursday when BTC did the unthinkable and increased from under $4000 to $20,000 in one year that was filled with uncertainty, fear, and the pandemic. The first learning of what was to come back in March 2020, started the Black Thursday panic selloff which crashed the number one cryptocurrency by 60% in a few days. The strong volatility measured by the VIX, is the biggest asset’s young history but since BTC was born in the Great Recession, VIX hasn’t had a sharp spike as that time, until this year.
The Volatility index back on Black Thursday spiked to above 20 and remained there since. The metric touched down on the key level before trying to turn back up which usually signals volatility as well. This could also be a bad sign with BTC trading below the resistance of $20,000 but according to the charts, most instances of the VIX rising beyond the reading of 20 led to a sharp selloff in crypto.

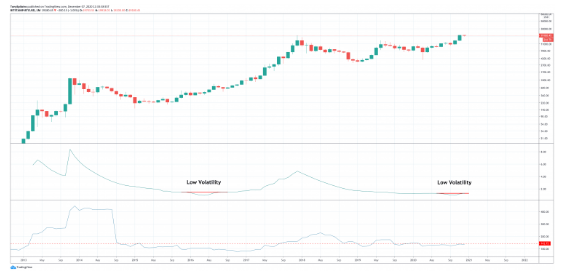
Volatility is defined as a representation of “how large an asset’s price swings around the mean price” adding that this is a statistical measure of the dispersion of returns. As the definition explains, volatility can move in either direction and doesn’t usually mean a drop. BTC is considered as one of the most volatile assets in history but even though it is testing the $20,000 price range, some tools show volatility levels are quite low. The resolution of low volatility usually phases in periods of heightened volatility which is measured by technical indicators and expressed in how wide the Bollinger bands are.
DC Forecasts is a leader in many crypto news categories, striving for the highest journalistic standards and abiding by a strict set of editorial policies. If you are interested to offer your expertise or contribute to our news website, feel free to contact us at [email protected]


Discussion about this post