BTC slumps further as other indicators point to another correction with the price remaining 10% below the recent highs with the major cryptocurrency continuing its slump after the selloff over the weekend. In our latest Bitcoin price news, we are reading more about the price analysis.
BTC slumps further as it continued to face downwards pressure and hovers around the $54K level with the volatility over the past week resulting in bulls losing their ground and losing $2.6 billion in liquidations according to ByBt. There were a few catalysts that led to the week’s drop from $61K and one of them was the Indian government proposing a bill to ban all of the private use of cryptocurrencies in the country and the other reason was due to the reports claiming that 18,961 BTC was flowing into Gemini crypto exchange.
We have been receiving messages asking about large #BTC inflows into Gemini.
Clarification: This is incorrect, the reported transactions were internal. Those are funds that were already on the exchange's wallets, and were simply transferred internally.https://t.co/o1kYsHMCuo pic.twitter.com/GjecVFfX8Y
— glassnode (@glassnode) March 15, 2021
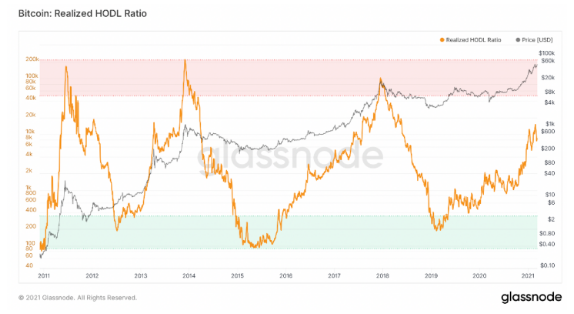
With the alleged $1 billion of BTC getting dumped, investors and speculators are taking part in the anticipation of another selloff. This was later proven to be false as the transfers turned out to be internal. BTC failed to bounce back higher and continued the downtrend alongside the equities markets. With the latest stimulus check having less impact than anticipated, the cryptocurrency was unable to gain more momentum to retest the recent all-time high. It’s possible that BTC will brush aside the correction and will continue the rally but the important indicator showed that the cryptocurrency could reach local tops soon. The RHODL indicator which is a ratio between short-term holders and long-term holders is still accelerating over the year.

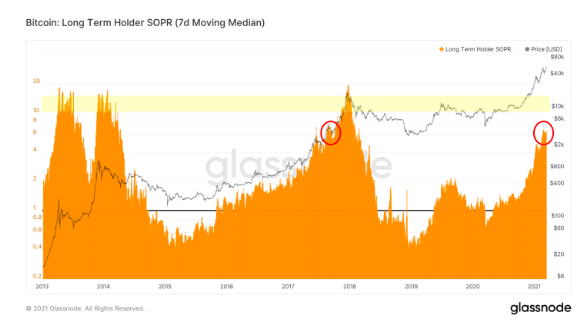
The indicator proves to be effective at identifying the highest price level of BTC’s past macrocycles so when the markets are approaching the top of the cycle, the indicator will enter a red area. this was the case in 2013 and 2017 where BTC suffered major losses while the current levels suggested that BTC is not overextended but it is getting closer. The long-term holder’s indicator shows that BTC is at a level that is similar to the second peak in 2017, right before bitcoin crashed.

As recently reported, Bitcoin struggled to clear the $60K resistance and dropped below the $58K with the price trading below it and the 100 hourly simple moving average and another key bearish trend line forming with the resistance near the $57K on the charts of the pair that will continue lower towards $54K as long as it is below the $58K resistance. Another failure to clear the $60K resistance means that BTC will drop lower and will enter the bearish zone.
DC Forecasts is a leader in many crypto news categories, striving for the highest journalistic standards and abiding by a strict set of editorial policies. If you are interested to offer your expertise or contribute to our news website, feel free to contact us at editor@dcforecasts.com


Discussion about this post