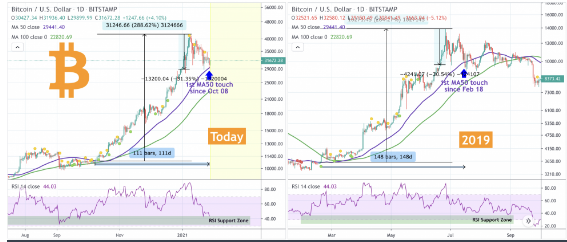
BTC replicates that fractal was seen in 2019 when the BTC/USD pair crashed by more than 50 percent as we are reading more in our latest Bitcoin news today.
According to the TradingShot data, BTC replicates the fractal of the downside correction move from its newly established ATH of $42,000, and it is very similar to the one of June 2019. That risks putting the pair on its way to new deeper price levels in the monthly session ahead of us. Both 2019 and today’s Parabolic Rises have a few common characteristics as TradingShot analysts noted:
“Both rose by approximately +385% from the time they last made contact with their 1D MA50 until their respective peaks. Both pulled-back from their peaks by approximately -30% on the low before contact was again made with the 1D MA50. At the time of the 1D MA50 test, the RSI was on the Support Zone.”

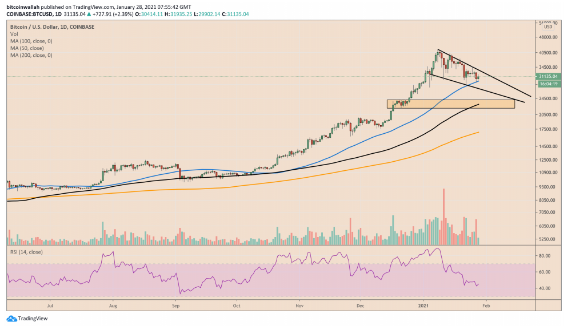
Bitcoin tested the 50-day moving average as support on Wednesday and its price dropped below $30,000. The cryptocurrency retraced slightly to the upside upon facing a stronger buying pressure. The bullish bias seemed limited due to the stronger US dollar only confirming the fears of a 2019 fractal-repeat. The company said that that the BTC/USD pair will have to hold above 50-DMA if it wants to keep the bullish outlook steady. If the pair breaks bearish on the support then, it risks dropping to the next average in the queue which is the 100-DMA. BTC is now sitting near $23,000 marking a crash of 45 percent from BTC’s high of $42,000.

In the meantime, the BTC/USD pair fights to stay above the 50-DMA and it could continue its rally back to the $40,000 and beyond. The theory from 2019 matches the bias in the technical indicators that point at a further bearish breakdown on the market. In Bitcoin’s case, the distance is about $13,000 which puts the cryptocurrency on its way to the 200-day moving average all the way to $17,000. In the meantime, Jonny Moe noted that this descending triangle will also shift into a falling wedge pattern which is bullish:
“I don’t think this is what we’re in for, but it’s at least worth acknowledging, the bull case here is that this isn’t a giant descending triangle, it’s some sort of falling wedge type pattern that would form a bottom basically right about where we are now.”
DC Forecasts is a leader in many crypto news categories, striving for the highest journalistic standards and abiding by a strict set of editorial policies. If you are interested to offer your expertise or contribute to our news website, feel free to contact us at editor@dcforecasts.com


Discussion about this post