BTC Broke the record for the longest weekly uptrend ever according to a crypto indicator that we read more about in today’s BTC news.
BTC had a major breakout last night and skyrocketed above $23,000 in what was a stellar move for the cryptocurrency. 2020 was quite monumental for a few reasons but it also marked some milestones like the one that BTC Broke the record for longest weekly uptrend ever according to the “parabolic” indicator.
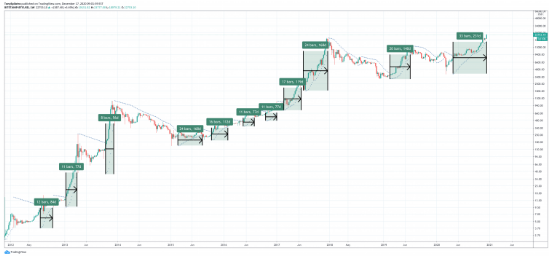
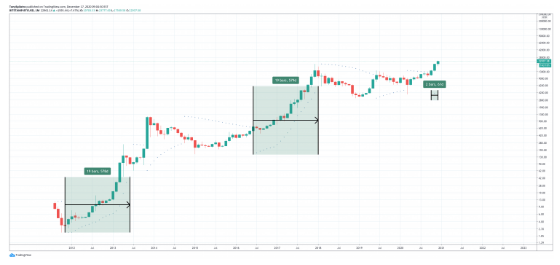
Although there were a few full market cycles in crypto, there were also three bull runs at least and a few bear phases. The second bearish phase has recently ended and left little to look back at to compare. What was obvious however was the repeated patterns and we could see that once BTC breaches its former all-time high the cryptocurrency went parabolic for a year. The resulting uptrends were the biggest impulses on the asset’s price chart and deliver the proven ROI of 2,000 to 5,000% across two previous parabolic phases.

The third time proved to work like a charm with BTC already setting a record for the longest weekly uptrend in its history of existence, according to the SAR indicator. What’s also notable is that this feat was achieved after the Black Thursday crash which was one of the unexpected events this year. Bitcoin is expected to enter a new parabolic phase soon and it could have already done so considering the strong uptrend so far. The SAR indicator is not used to decipher when it will happen but it can help understand when the parabola has been broken.
In the charts shown, the parabolic SAR showed that the biggest strength of weekly positive SAR under the price action was set which shows a bullish momentum that lasted over 200 days. the next longest uptrend on the weekly scales was set for the 2017 rally that took BTC to $20,000 for the first time. The indicator is among the most simple ones to use but the uses vary. Once a price action passes through a SAR dot and closes, it shows that the trend has reversed and the parabola was broken.

The most recent trend change happened during the Black Thursday selloff but since then, the asset has only increased. Traders can utilize the parabolic SAR indicator that was developed by J. Welles Wilder Jr as part of the trailing stop strategy where the stop loss is moved up or down with each SAR dot.
DC Forecasts is a leader in many crypto news categories, striving for the highest journalistic standards and abiding by a strict set of editorial policies. If you are interested to offer your expertise or contribute to our news website, feel free to contact us at [email protected]


Discussion about this post