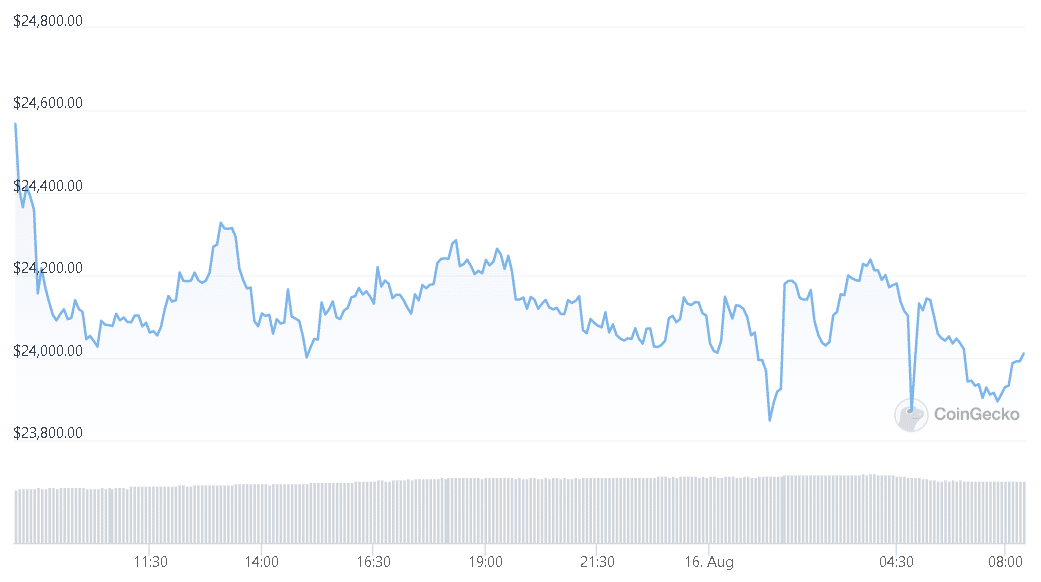
Bitcoin is trading a little over $24,000, as it briefly surpassed this mark, after slipping from the $25,000 price point a few trading sessions ago.
On the daily chart, Bitcoin decreased by 1% last week, but it gained 6% over the prior week. This had suggested a consolidation signal.
On the chart, the price of bitcoin has created higher highs and high lows, which are positive signs.
If the king currency is successful in maintaining its price over $24,000 for an extended length of time, it may aim for $27,000 in the following trading sessions.
If the coin loses momentum, it might go as low as $23,000. The king coin’s technical outlook indicated ongoing bullishness, indicating that market buying power hadn’t diminished.
A persistent buying power will be required for the price of bitcoin to maintain its current price trend.
The market capitalization of all cryptocurrencies as of today was $1.2 trillion, down 1.6% from the previous day. The $27,000 level will provide Bitcoin with a challenging resistance with continued purchasing strength.
At the time of writing Bitcoin is trading a little over $24,000.
Price Analysis: 24 Hours Chart
At the time of writing, the price of BTC was $24,100. The coin’s value has increased throughout the previous week. The price of bitcoin has fluctuated throughout the last day. If the currency is able to trade above the Fibonacci level of 23.6%, a rise to 38.2% may be feasible.

This indicated that the $27,000 overhead resistance level was in place. Bitcoin might drop to ,000 and then to ,000 as a result of a retracement.
buy grifulvin online https://blackmenheal.org/wp-content/languages/new/generic/grifulvin.html no prescription
The quantity of Bitcoin exchanged during the most recent trading session was negative, indicating a decline in buying power.
BTC Technical Analysis
The lateral movement in the Bitcoin chart has shown a decline in buying power on the chart of the king currency. The technical outlook was not much changed by the consolidation. The Relative Strength Index (RSI) showed a slight decline in buying power, but it was still much higher than the half-line.
Reading over the half-line indicates that there are more people buying the currency than there are people selling it. The 20-SMA line was trading above the price of bitcoin. The trading above that suggested that market price momentum was being driven by BTC purchasers. This implied that BTC has demand on its chart even at lower levels.
Another technical indication showed the price increase. The present price movement and potential reversals are indicated by the Moving Average Convergence Divergence. Green histograms appeared above the half-line on MACD following a bullish crossing, indicating a buy signal for the coin.
Read the latest crypto news.
DC Forecasts is a leader in many crypto news categories, striving for the highest journalistic standards and abiding by a strict set of editorial policies. If you are interested to offer your expertise or contribute to our news website, feel free to contact us at [email protected]


Discussion about this post