Bitcoin behaves just as it did back in 2016 when it managed to increase massively in price. BTC increased from $7K to $$9K in less than a day and it allowed the cryptocurrency to start a strong month, finishing the previous one with a bullish engulfing candle. In our Bitcoin news today, we take a closer look at what the analysts have to say.
While many see the candle as a positive sign, one trader believes that this can also be a bad sign noting the bullish engulfing candle can be seen as a misnomer. The Technician Thomas Bulkowski wrote that the engulfing candlesticks are signs of macro reversals:
“[These candles] act as a temporary reversal of a downward price trend. This is also one of the trading setups I suggest you avoid. Why? Because the primary trend is downward. The bullish engulfing candlestick reverse that trend, but only for a short time. The primary downward trend takes over and price resumes falling.”
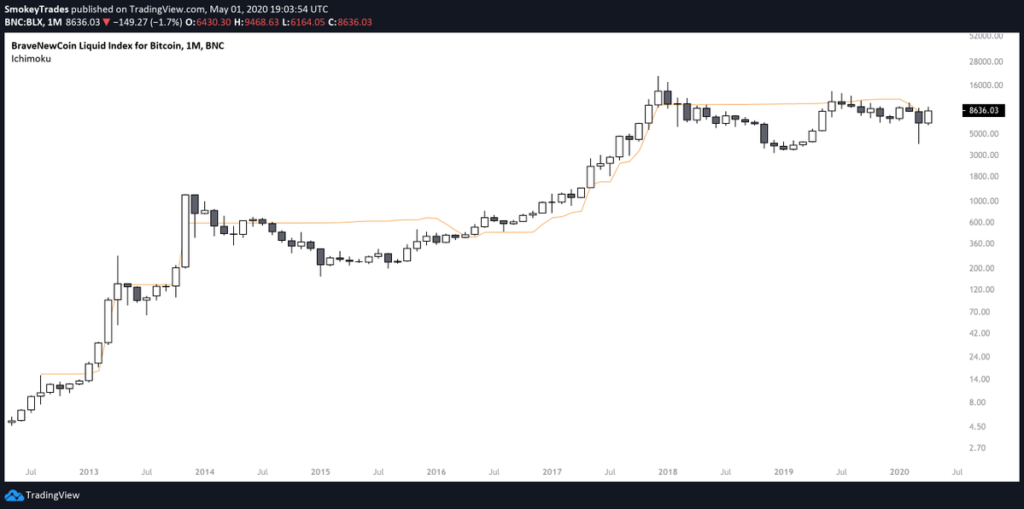
Bitcoin behaves strongly, making a technical accomplishment that could actually negate the bearish effect on the engulfing candles. According to a crypto trader, the strong rebound for Bitcoin in April saw the cryptocurrency close the candle above the key level of the Ichimoku Cloud on the monthly charts. This is very important for Bitcoin since the last time BTC claimed the technical level was in 2016 when it was trading at $500 before making a $4000% rally which brought the price of the asset to $20,000 by the start of 2017. This historical movement suggests that the crypto market is going to make a new parabolic rally.

This is the latest of the many historical signs that the price of BTC could erupt into a full-blown bull run. The trend earlier this week was extremely strong that during the peak of the Wednesday rally, one trader saw an unexpected technical occurrence. The RSI for the one-hour chart of BTC hit 96.5 which is a few points below the oscillator- 100. The traditional forms of the technical analysis show that whenever the RSI passes 70, it is an overbought territory.
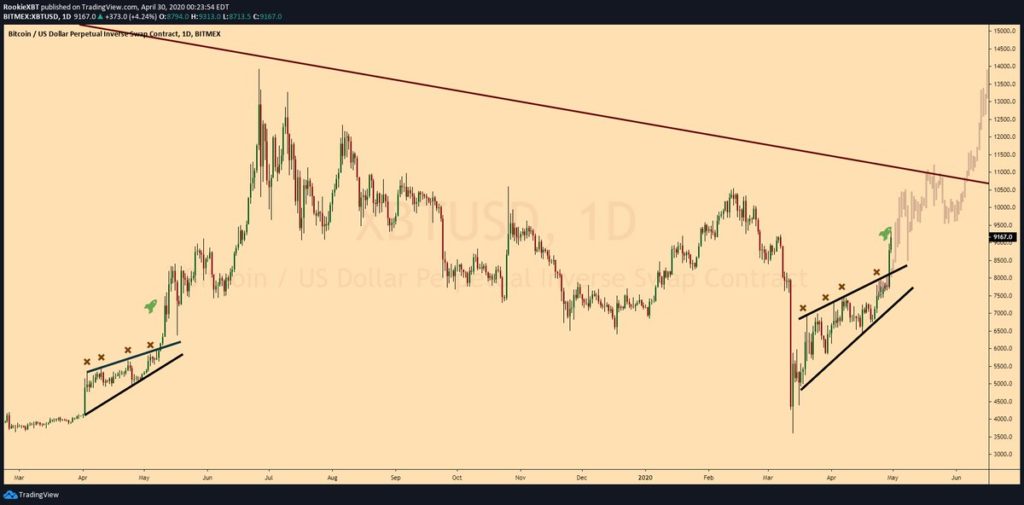
The fact that the RSI for Bitcoin on the hourly charts hits 96.5, means that it was extremely overbought. According to another analyst, the last time when Bitcoin increased so high was in April 2019 when the price skyrocketed 25% higher in only a few hours. After the spike, there was an extended rally from $4,000 to $14,000 in only three months.

Bitcoin behaves just as it did back in 2016 when it managed to increase massively in price. BTC increased from $7K to $$9K in less than a day and it allowed the cryptocurrency to start a strong month, finishing the previous one with a bullish engulfing candle. In our Bitcoin news today, we take a closer look at what the analysts have to say.
While many see the candle as a positive sign, one trader believes that this can also be a bad sign noting the bullish engulfing candle can be seen as a misnomer. The Technician Thomas Bulkowski wrote that the engulfing candlesticks are signs of macro reversals:
“[These candles] act as a temporary reversal of a downward price trend. This is also one of the trading setups I suggest you avoid. Why? Because the primary trend is downward. The bullish engulfing candlestick reverse that trend, but only for a short time. The primary downward trend takes over and price resumes falling.”
Bitcoin behaves strongly, making a technical accomplishment that could actually negate the bearish effect on the engulfing candles. According to a crypto trader, the strong rebound for Bitcoin in April saw the cryptocurrency close the candle above the key level of the Ichimoku Cloud on the monthly charts. This is very important for Bitcoin since the last time BTC claimed the technical level was in 2016 when it was trading at $500 before making a $4000% rally which brought the price of the asset to $20,000 by the start of 2017. This historical movement suggests that the crypto market is going to make a new parabolic rally.

This is the latest of the many historical signs that the price of BTC could erupt into a full-blown bull run. The trend earlier this week was extremely strong that during the peak of the Wednesday rally, one trader saw an unexpected technical occurrence. The RSI for the one-hour chart of BTC hit 96.5 which is a few points below the oscillator- 100. The traditional forms of the technical analysis show that whenever the RSI passes 70, it is an overbought territory.
The fact that the RSI for Bitcoin on the hourly charts hits 96.5, means that it was extremely overbought. According to another analyst, the last time when Bitcoin increased so high was in April 2019 when the price skyrocketed 25% higher in only a few hours. After the spike, there was an extended rally from $4,000 to $14,000 in only three months.

DC Forecasts is a leader in many crypto news categories, striving for the highest journalistic standards and abiding by a strict set of editorial policies. If you are interested to offer your expertise or contribute to our news website, feel free to contact us at [email protected]


Discussion about this post