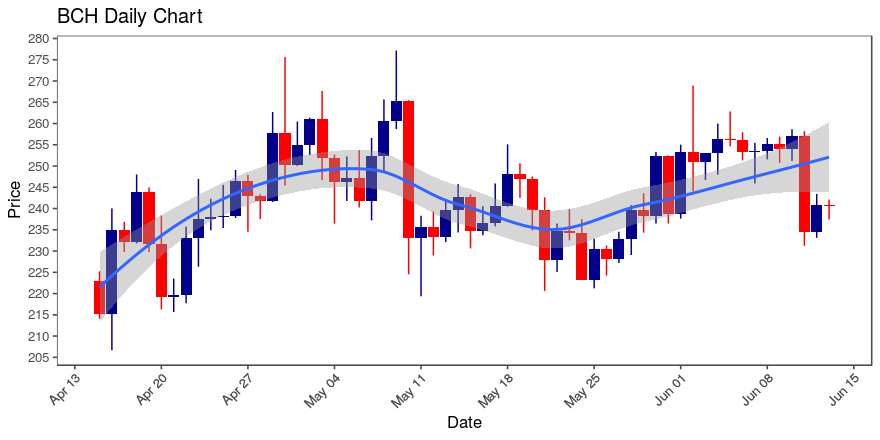
It seems that on the latest charts there is a Bitcoin Cash pin bar pattern creating as the altcoin entered the day down by 0.02% as we are reading more in the latest bitcoin cash news.
Bitcoin Cash entered the 4-hour candle at $239 which is an increase of 0.44% from the previous 4-hours. The asset ranked 4th compared to the other top crypto asset classes, in the past 4 hours in terms of percentage price change. Bitcoin Cash Entered today at $240 which is down by 0.02% from the previous day. This move happened during a lower volume as the volume from yesterday decreased by 52% and down by 27% from the same day the week before. Compared to other instruments in the Top crypto asset classes, Bitcoin Class ranked 4th since the previous day in terms of percentage price change.

Coming into the current price of Bitcoin Cash today, BCH is sitting close to the 20,50 and 100 day moving averages as the cross often shows a change in momentum so this could be worth watching out on. The clearest trend exists on the 30-day timeframe which shows the price moving up over time. To see things another way, note that out of the past 10 days bitcoin Cash’s price went up during 5 of them. As for those that trade-off of candlesticks, we should say that there is a Bitcoin Cash pin bar pattern appearing.
Bitcoin Cash BCH Current Price:
$238.33
1 Hour: -0.65 % | 24 Hours: -0.78 % | 7 Days: -5.01 %#bch #bitcoin cash— aWebAnalysis (@aWebAnalysis) June 14, 2020
As per the previous Bitcoin cash news, we reported that Bitcoin Cash embarked on a fresh new uptrend after the bull run failed to break the resistance at $256 and the $270 level. BCH rebounded three times to reach the $270 high. The bearish reaction occurred and led the coin to drop suddenly. Right after that, the price corrected upward to the $260 high but the upward move resulted in a price tussle as the bears overwhelmed the bulls.
Also, Bitcoin Cash crushed a key resistance level, trading above the $250 support line, and now it is likely that the altcoin will continue higher towards the $270 resistance level. There was a break above the 50% fib retracement level of the previous $263 high to the $246 low. What is even more important, there was a break above the key contracting triangle with a resistance close to the $255 on the 4-hour charts of the BCH/USD pair.
DC Forecasts is a leader in many crypto news categories, striving for the highest journalistic standards and abiding by a strict set of editorial policies. If you are interested to offer your expertise or contribute to our news website, feel free to contact us at editor@dcforecasts.com


Discussion about this post