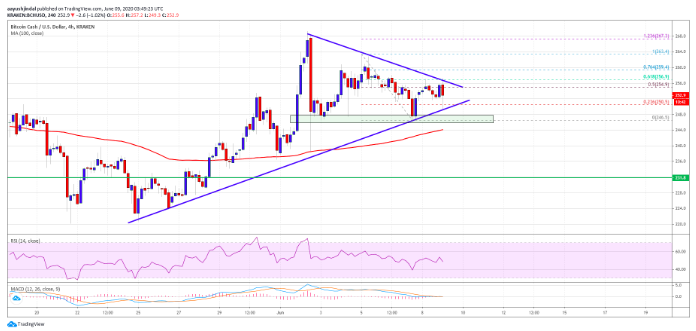
The price of Bitcoin Cash BCH could rally again as analysts note, but is in a vulnerable position right now. We can see that the proud member of the top 5 cryptocurrency list seems to be preparing for the next crucial break either above the $260 mark or towards the $230 support line.
After the strong increase above $250, the price of BCH could rally again. However, sellers were found near the $268 level as the BCH price formed a new monthly high near this mark and started a downside correction once it was secured.
We can also see a break below the $265 support zone and the price even spiked below $250. A low is now formed near the $246 level and the price is currently well above the 100 simple moving average on 4 hours.

What is very noticeable is that the last swing was near $263 and the recent low was near $246. Bitcoin Cash is now trading in a range (similar to Bitcoin) above the $250 support. It tested the 50% Fib retracement level of the recent decline from a $263 high to a $246 low.
More importantly, we can notice a key contracting triangle forming with resistance near $255 on the 4-hours chart of BCH/USD. The triangle resistance is close to the 61.8% Fib retracement level showing that BCH could rally soon.
Still, there is pressure due to the recent decline from the $263 high to a $246 low in the Bitcoin Cash news. An upside break and downside correction are equal at this point because of the low volume.
Anyways, the next key hurdle as analysts predict is the $260 level – something which could open the doors for a fresh increase. After that, the resistance is set at $268 and $270, above which the bulls can test the $300 handle in the near term.
If the price of Bitcoin Cash breaks the triangle support, BCH could rally and the next major support is near the $244 in a case like this. Any further losses might trigger a decline towards $230 and overall, the price could either sharply rise above $260 or start a decline below $250.
The technical indicators for BCH in the cryptocurrency news are as following:
- Hourly MACD – The MACD for BCH/USD is struggling to gain pace in the bullish zone.
- Hourly RSI (Relative Strength Index) – The RSI for BCH/USD is currently just below the 50 level.
- Key Resistance Levels – $260 and $270.
DC Forecasts is a leader in many crypto news categories, striving for the highest journalistic standards and abiding by a strict set of editorial policies. If you are interested to offer your expertise or contribute to our news website, feel free to contact us at [email protected]


Discussion about this post