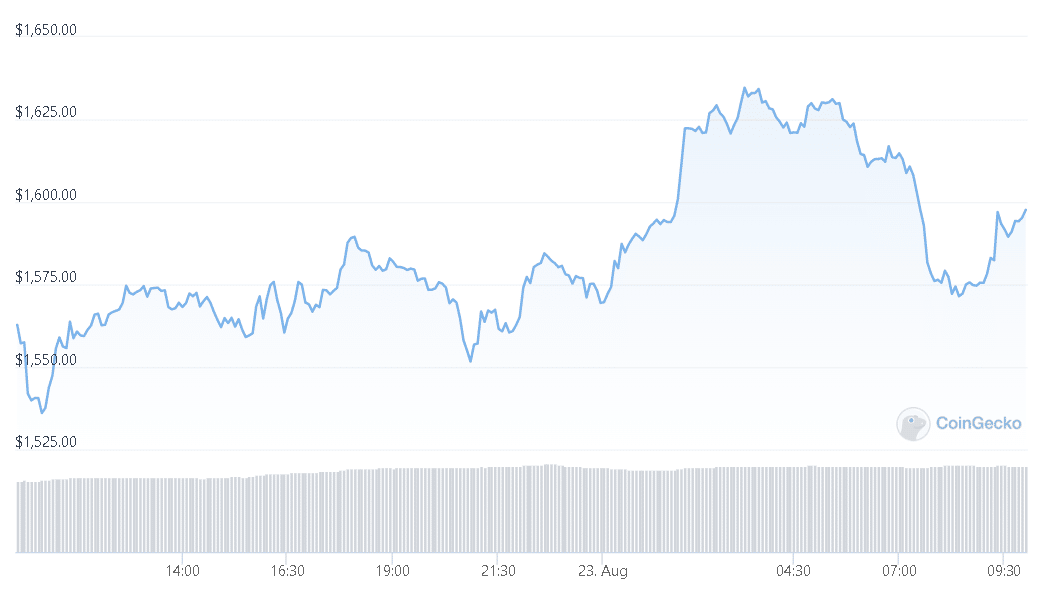
Ethereum’s price is down by 20% weekly, with the cryptocurrency being in a spiral that has seen it struggling for a while. But, ETH suffered significantly last week.
The coin’s current price movement might be attributed to broader market weakness. Bitcoin has dropped in price and was selling at $21,000 at the time of writing.
Other cryptocurrencies fell in value as a result of BTC’s price behavior. Ethereum’s price has dropped by 4% in the previous 24 hours. Since the coin’s price dropped below $2,000, there has been a persistent downward trend. The technical forecast for the Ethereum price was similarly gloomy at the time of writing, as sellers had assumed control.
If selling momentum takes control, Ethereum might lose its support level and plummet further. The currency also created a declining line that intersected with the ETH’s difficult resistance mark.
If Ethereum manages to hold above its immediate support level, it may not trade near the $1,300 support level after all. The worldwide cryptocurrency market worth is at $1.05 trillion, down 2.1% in the previous 24 hours.
ETH Price Analysis – 24 hours
Ethereum’s price is down by 20% weekly i.e. it fell the most last week.

At the time of writing, ETH was worth $1,567. Since the coin’s price dipped below $2,000, it has been in a steady free decline. The altcoin’s recent strong barrier was around $1,700, and a rise above it would take Ethereum price to $1,900. It remains to be seen whether Ethereum can sustain its position above its immediate support level.
At the time of writing, the currency was trading extremely close to $1,500, its immediate support level. The downward trendline was also crossing the $1,700 price barrier, indicating that the aforementioned level is significant. The amount of ETH exchanged rose, indicating that the selling impetus has risen.
Technical Analysis
On its chart, the current price movement of ETH showed an increase in selling pressure. At press time, the Relative Strength Index was below the half-line, indicating that sellers outnumbered purchases.
This was due to the coin’s unfavorable price activity. The price of Ethereum was below the 20-SMA; a reading above that indicated that sellers were driving the market’s price momentum.
The downward trend of ETH on its chart has caused purchasers to lose faith in the asset. Moving Average Convergence Divergence indicates price momentum and the possibility of a shift in momentum. MACD made a bearish crossing and painted red histograms, indicating a sell signal for the coin.
Read the latest Ethereum news.
DC Forecasts is a leader in many crypto news categories, striving for the highest journalistic standards and abiding by a strict set of editorial policies. If you are interested to offer your expertise or contribute to our news website, feel free to contact us at [email protected]


Discussion about this post