Polkadot rises 4% and sets eyes on the $9 price range while in the past week, DOT remained optimistic and registered a 7% increase in value so let’s read more today in our latest cryptocurrency news.
The price momentum held on to the bulls at the moment and after moving past this resistance of $8, the bulls gained power. The technical outlook pointed towards a positive price action for DOT and the buyign strength of the altcoin also noted an increase which contributed to the rise in price. If the demand remained consistent in the market it will be quite easy for Polakdot to cross the next resistance mark. As BTC continued to move northwards and traded near $23,000, other altcoins were affected by the price movement so now the bulls tried to maintain the recovery mode which DOT displayed on the charts. The global crypto market cap today hit $1.14 trillion with 0.6% negative change in the past day.

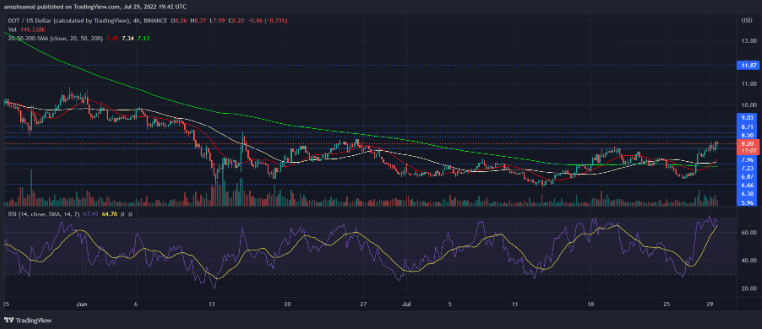
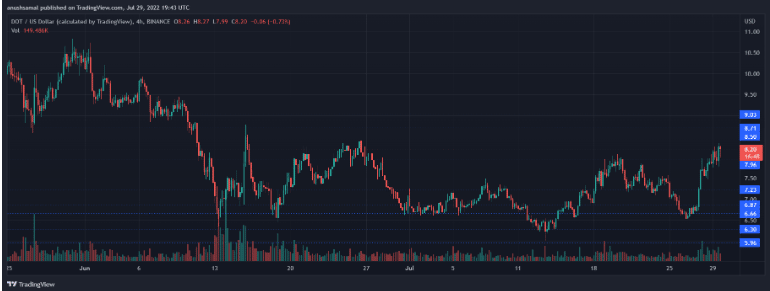
DOT was trading at $8.20 and the altcoin managed to break past the tough resistance mark of $8 which made the bullish force stronger on the markets. The demand for the coin helped the recovery and the overhead resistance for the altcoin was set at $9 in case DOT manages to trade above the level and could enter the double-digit price zone. Falling from the current price level will make DOT land up to $7.20 and then to $6.87 while the amount of DOT traded in the previous session dropped a little which indicated that the selling pressure could be trying to make an entrance on the chart.
The altcoin was bullish on the short time frame and traded in the overbought zone as the coin launched a rally over the past week. The buying strength remained positive and took over the selling strength too. The RSI displayed smaller downticks in buying pressure but it remained a lot more than just selling pressure at press time. Polkadot rises 4% in the past day and it shows signs that the buyers were driving the price momentum of the coin. DOT was above the 50-SMA and 200-SMA showing an increase in demand and bullish force on the markets.

DOT’s technical outlook reflected a surge in demand on the four-hour charts and the MACD read the price momentum and a shift in price action. The MACD underwent a bullish crossover and provided a green histogram chart above the half-line showing a buying signal.
DC Forecasts is a leader in many crypto news categories, striving for the highest journalistic standards and abiding by a strict set of editorial policies. If you are interested to offer your expertise or contribute to our news website, feel free to contact us at editor@dcforecasts.com


Discussion about this post