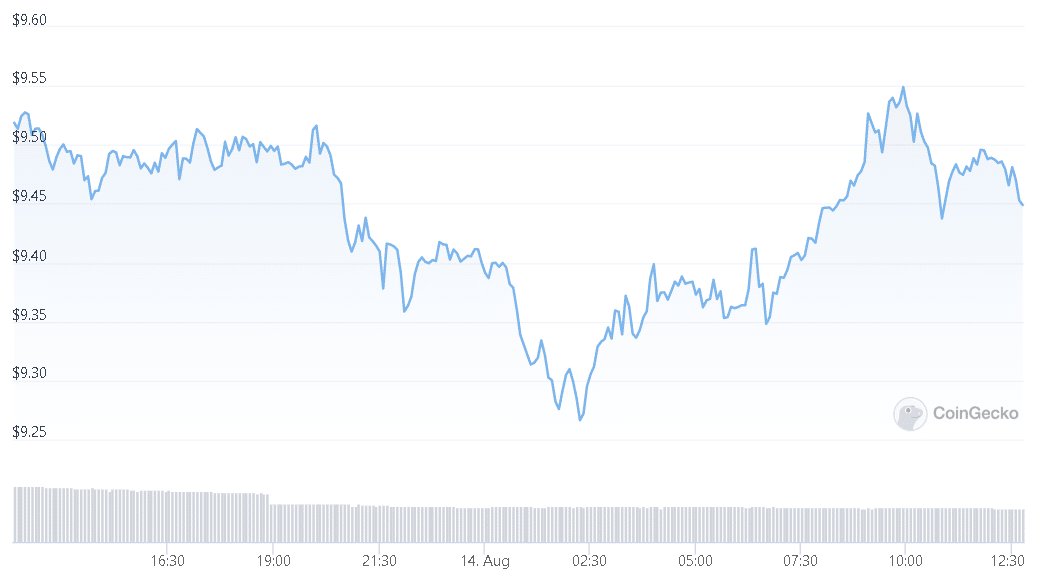
Polkadot $9.98 resistance retest eminent according to market indicators and our analysis. Price analysis of Polkadot (DOT) shows that a strong bullish trend propelled the stock to a $9.54 high.
Extremely positive on the DOT price; about to retest $9.88 major resistance level.
Support has been seen at $9.29. Polkadot raised the cost to $9.54.
Following the coin’s massive gains over the previous few days, the price trendline for DOT has been rising over the past several weeks.
DOT/USD is currently attempting to test the $9.87 significant resistance level, which is rather powerful. However, if the bulls push much harder, DOT won’t have any trouble breaking through this crucial resistance area. Polkadot $9.98 resistance retest is eminent.
DOT Price Swelled To $9.54
The DOT price increased to $9.54 a few hours ago, indicating an increase in pricing worth over the previous 24 hours.
DOT is now trading at $9.49 on CoinMarketCap, up an incredible 2.20% as of the time of this writing. The DOT price dropped gradually over a short period of time but is still in the green lane. The astounding 10.05% value increase in the DOT/USD pair during the previous week suggests that the bull run will continue.
However, DOT trade volume sharply decreased by 12.66%, indicating certain areas of momentum weakness.
The extension of the Bollinger bands indicates that the DOT/USD pair is more volatile than usual. The lower band, or $6.84, is positioned to act as the coin’s current support zone while the upper band, or $9.99, is viewed to represent the price’s current main resistance.
Furthermore, the RSI is at 64 and the EMA is seen at $9.10, all of which point to significant market buying pressure.

Price Correction Might Be Coming
The DOT price burst higher at the beginning of the trading day, which caused the price to soar to $9.58. However, as the selling pressure reappeared, the price also declined in the following hours.
The DOT 4-hour chart displays a relatively low level of volatility. While the bottom band is located at $8.73, the upper band is found at $9.84. Furthermore, the RSI continues to trade at index 62, driven by the intense selling pressure, while the EMA continues to trade around the $9.35 level.
The fact that the DOT price is still observed trading in the green indicates that the currency is putting in a lot of effort to overcome the important resistance level at $9.87. Before the coin retests the crucial resistance zone again, a short-term price drop is anticipated.
On the other side, if the bears are successful in outnumbering the bulls, DOT may continue to cling to $9.29 as its next level of support.
Check more of today’s news.
DC Forecasts is a leader in many crypto news categories, striving for the highest journalistic standards and abiding by a strict set of editorial policies. If you are interested to offer your expertise or contribute to our news website, feel free to contact us at editor@dcforecasts.com


Discussion about this post