Solana’s price faces a bearish momentum, as big market coins depreciated dramatically lately, Solana has been affected and its price had a tremendous negative drag.
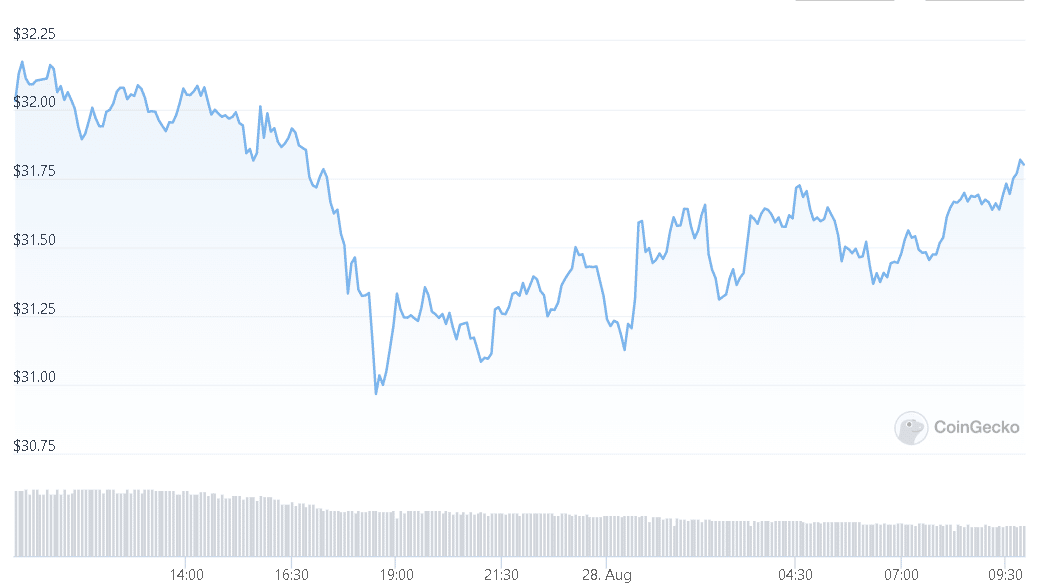
The altcoin has dropped by 6% in the previous 24 hours. Solana has lost 14% of its market value in the last week and now Solana’s price faces a bearish momentum.
The bulls were attempting to defend the currency at its nearest support level, but the coin has seen a sell-off in the last 24 hours.
Solana has been trading sideways above its support level of $34 in recent days. The latest chart devaluation forced SOL to go below its immediate support level.
If the price of Solana continues on its current path, a drop below its current level is unavoidable. The coin’s technical outlook indicated bearishness.

As purchasers lost confidence, selling strength increased during the previous 24 hours. SOL will return to the $28 pricing level if the price falls below $31.
The worldwide cryptocurrency market worth is at $1.01 trillion, down 3.5% in the previous 24 hours.
Solana Price Analysis
At the time of writing, SOL was trading for $31. The currency had just lost support at the $34 level and was looking for the next level of support.
The coin’s nearest support level was $28. The coin’s overhead resistance was $37. If the currency manages to re-enter the $34 zone, a rise over that price level is possible.
If the Solana price cannot hold at its current level, a drop below the $28 barrier is likely in the coming trading sessions.
The volume of SOL traded in the previous session decreased, indicating poor demand and increasing selling strength.
Technical Analysis
At the time of writing, SOL showed a decline in purchasing power. The technical signal indicated a rise in selling strength.
At the time of writing, the Relative Strength Index was below 20, indicating that sellers outnumbered purchasers.
Solana was discounted on the four-hour chart because to lesser demand. Solana’s price was below the 20-SMA line, indicating that sellers were driving the market’s price momentum.
On its four-hour chart, SOL had a sell signal. The technical indications indicated to forthcoming bearishness in the following trading sessions.
Moving Average Convergence Divergence signals price momentum and the possibility of a reversal.
The MACD signaled a bearish crossing and generated red signal bars below the half-line, indicating a sell signal for the coin.
Read the latest crypto news.
DC Forecasts is a leader in many crypto news categories, striving for the highest journalistic standards and abiding by a strict set of editorial policies. If you are interested to offer your expertise or contribute to our news website, feel free to contact us at [email protected]


Discussion about this post