Solana SOL eyes $150 price level in April as it jumped past the key selloff junction and entered the overbought territory which proves that the bulls are not scared of the excessive valuations so let’s read more in today’s latest altcoin news.
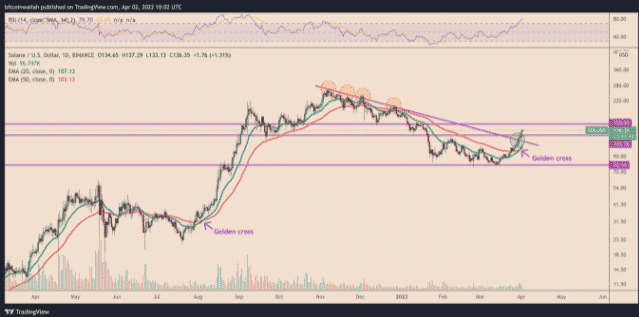
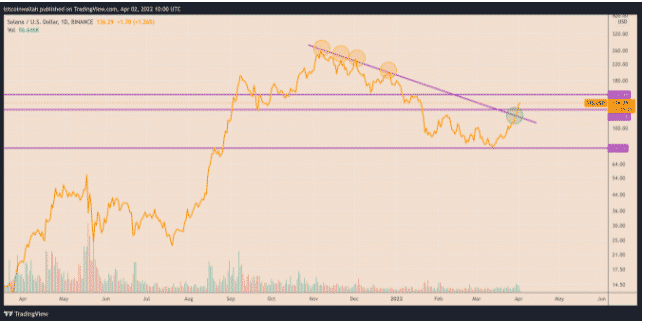
Solana jumped past the critical resistance level which had limited the recovery attempts during the November 2021 March 2022 price correction a few times thus raising hopes of more upside this month. To recap, SOL’s price underwent strong pullbacks upon testing the multi-month downward slope trendline. For example, the SOL/USD pair dropped by 60% in the past two months after retracing from the resistance level in December 2021. it dropped by over 40% in a similar retracement move that was led by a strong selloff near the trendline in November 2021.

Solana flipped the resistance trendline as support after breaking above it on March 30 which was followed by the rise in trading volume which showed the traders’ conviction in a breakout move and by doing so, SOL’s price rallied by 25% to reach $135 which brought the psychological resistance level of $150 in its reach. From a technical perspective, SOL’s breakout move above the falling trendline resistance coincided with the crossover between the main two moving averages which are the 20-day exponential moving average and the 50-day EMA.
The golden cross occurs when the asset’s short-term moving average jumps above the long-term moving average and the analysts consider this crossover as a buying signal. For example, the 20-50 EMA crossover assisted in pushing SOL’s price upwards by 650% spiked by other fundamental and technical catalysts as well. The golden cross boosts SOL’s chances of continuing the rally. Solana SOL eyes a $150 level in April as the pair continues its uptrend when using the Fib retracement levels.

The crypto research shows a correlation between SOL’s price and the combination of both technical indicators, the S/R flip, and the RSI divergence. The first time that SOL jumped above 70 led to a break above the descending trendline support of the period and then continued rallying despite its RSI consolidating lower. SOL rallied 378% after the first time that its RSI Broke above 70 and the period of the overbought RSI in 2021 also coincided with the 268% upside move. The fractals seemed similar to how SOL was performing and a pullback upon the $147 level can result in SOL retesting the $120 as interim support with a possible drop to the 20-50 EMAs.
DC Forecasts is a leader in many crypto news categories, striving for the highest journalistic standards and abiding by a strict set of editorial policies. If you are interested to offer your expertise or contribute to our news website, feel free to contact us at editor@dcforecasts.com


Discussion about this post