Ethereum nears inflection zone after it traded to a new yearly high at $636, before correcting lower against the US dollar. Now, the price is showing bearish signs and it could decline even more if there’s a break below the $570 level so let’s read more about it in the latest ETH news today.
Ethereum started a downside correction after it traded at its yearly high of 6.
buy kamagra gold online https://www.illustrateddailynews.com/wp-content/themes/twentytwentytwo/parts/new/kamagra-gold.html no prescription
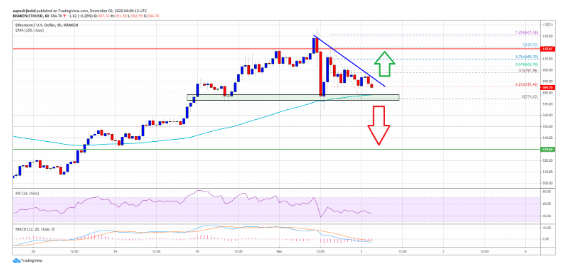
The price was trading below the $600 level and approached the 100 hourly simple moving average. There’s a key bearish trend line forming with the resistance nearing the $590 zone on the hourly charts of the pair with the pair likely to continue to lower it if it fails to stay above the $570 level. There was an increase in ETH above the $600 and the $620 levels with the price breaking the previous swings high and trading to a new yearly high of $636. The bulls had a hard time gaining strength which resulted in a sharp decline below the $620 levels.

The price broke the $600 support level and moved into the short-term bearish zone but a new low was then formed near the $574 and the price is now consolidating the losses. ETH traded above the 23.6% fib retracement level from the decline at $620 high to the $574 low so it is now facing a strong resistance near the $595 levels. There’s also a key bearish trend line that is forming with the resistance nearing the $590 level on the hourly charts of the pair with a 50% fib retracement level from the decline at $620 high to the $574 low. breaking above these trend lines could start another increase.

Ethereum nears inflection zone at the next key resistance level of $600 but if it manages to surpass it, it could lead the price towards the $620 resistance in the near-term. If Ethereum fails to clear this trendline resistance, it could suffer more drops with the initial support of $575 being the first target. The main support near this level is now forming so a close below it and the 100 SMA could start a decline to the $550 level or even $530. The hourly MACD for the pair is gaining momentum in the bearish zone, while the hourly RSI for the pair is well below the 50 levels.
DC Forecasts is a leader in many crypto news categories, striving for the highest journalistic standards and abiding by a strict set of editorial policies. If you are interested to offer your expertise or contribute to our news website, feel free to contact us at editor@dcforecasts.com


Discussion about this post