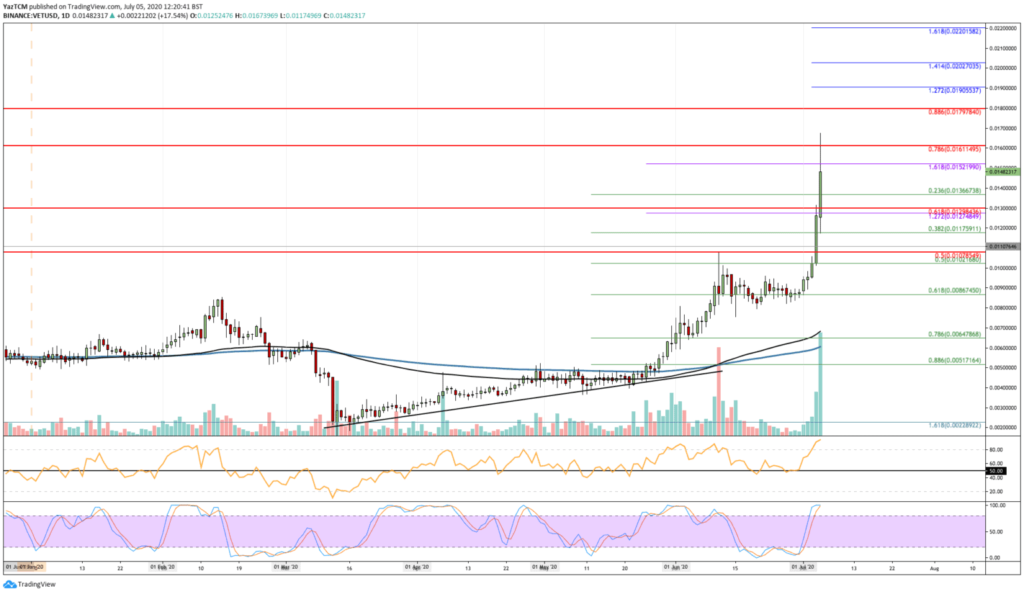
The VET price charts show that the altcoin increased by 65% in the past seven days, especially in the past 24-hours as it reached $0.0168. In our latest VeChain Vet news we take a closer look at the price analysis.
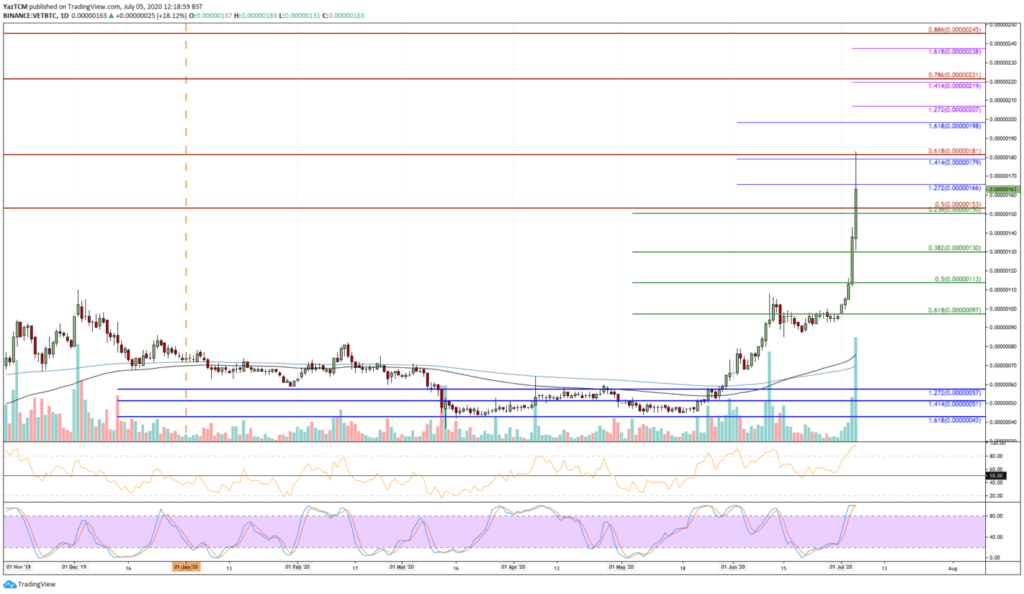
The coin was on a rampage this week after surging more than 65%, while against Bitcoin it created a fresh 19month high, reaching the 180 SAT level.
buy xifaxan online https://buywithoutprescriptionrxonline.com/dir/xifaxan.html no prescription
The support for the VET/USD price pair stands at The support for the VET/USD price pair stands at $0..
buy ventolin online https://buywithoutprescriptionrxonline.com/dir/ventolin.html no prescription
0136, $0.011, and $0.01 while for the VET/BTC pair it stands at $150 SAT, $130 SAT, and $113 SAT. The price surge this week caused VET to increase to a fresh 22-month high as the coin reached the $0.0168 level as it then started climbing in May 2020 when it broke above the 200-day EMA and pushed higher to $0.007.

In June it increased even higher but had a hard time breaking the resistance at $0.0107 level which was broken in July 2020 when VET price charts showed a $0.013 level and will reach the $0.0161 resistance and peak above it. If the buyers continue to push VET higher, the first two levels of resistance are located at $0.0152 while above this the added resistance lies at $0.018 and $0.020. On the other side, the sellers can push lower while the first level of support is located at $0.0136, beneath this added support is found at $0.011 and $0.0086.
The RSI is above the 50 line to show if the buyers dominate the entire market momentum but the Stochastic RSI is in overbought territory, remaining primed for a bearish crossover that could even send the price lower. Against Bitcoin, VET was surging in the same manner as the coin pushed higher from 100 SAT at the beginning of July to reach the current resistance at the 181 SAT level. The price increase allowed it to create a new 19-month price high against BTC and VET was dropping from 181 SAT as it trades at 162 SAT.

If the bulls push higher, the first strong resistance level for the altcoin lies at 181 SAT and above this resistance, it lies at 200 SAT and 238 SAT. On the other side, the first level of support lies at 150 SAT, beneath this the support is found at 130 SAT. The Stochastic RSI is overbought and is primed for another bullish crossover signal that will send the market lower.
DC Forecasts is a leader in many crypto news categories, striving for the highest journalistic standards and abiding by a strict set of editorial policies. If you are interested to offer your expertise or contribute to our news website, feel free to contact us at [email protected]


Discussion about this post