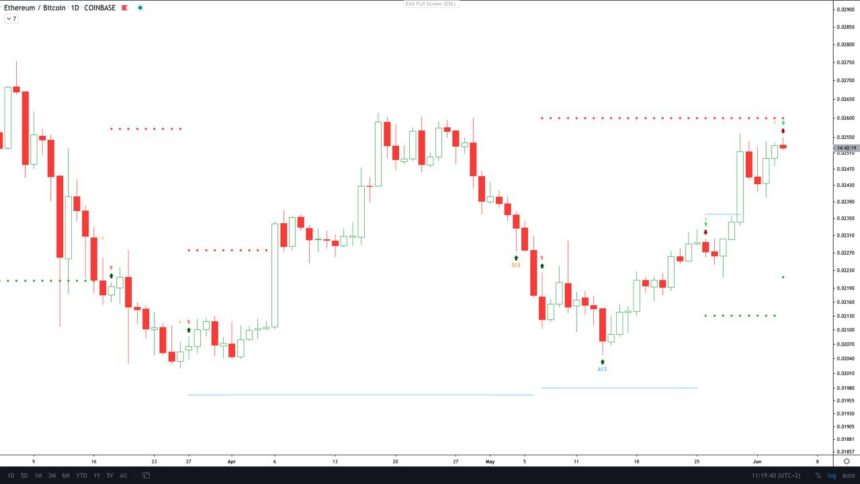
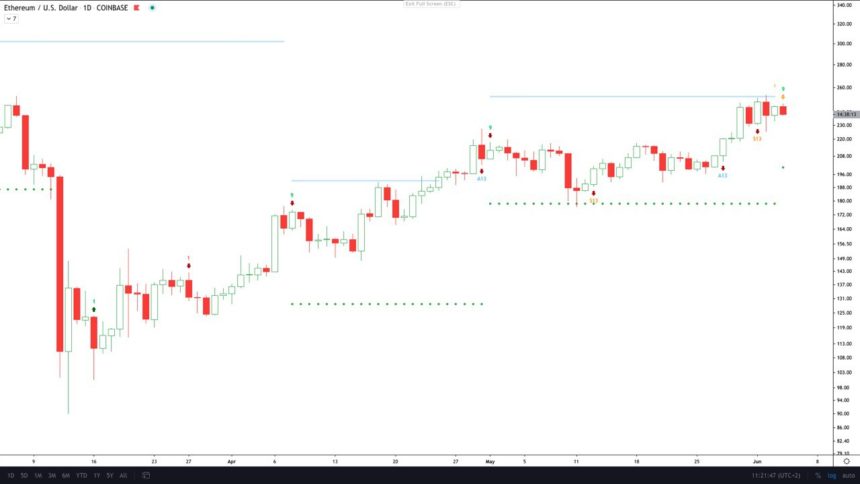
The most accurate sell signal shows that ETH is primed for an epic drop against BTC as investors are bullish on the price compared to Bitcoin.
buy tadalafil online https://www.arborvita.com/wp-content/themes/twentytwentytwo/inc/patterns/new/tadalafil.html no prescription
The long positions in Ethereum continue to skyrocket while the amount of ETH locked up in DeFi grows by the day as we are reading in the following Ethereum price news.
The most accurate sell signal has just triggered on both the ETH/USD and ETH/BTC price charts that suggest how the altcoin in the space could soon be going into a strong correction. Ethereum continues to struggle with a resistance level of $250 as Bitcoin fails to hold above the $10,000 price level. Ethereum however, remained down by 82% from the asset’s former all-time high level while Bitcoin sits at nearly 50% recovery. The asset set the record just as the crypto bubble started bursting in 2018.

The price per ETH token then collapsed to $80 while the current price represents an over 200% return but another 475% would be needed to get back to the record of more than $1,400. The upcoming ETH 2.0 launch and the massive surge in growth of defi finance, only contribute to the bullish sentiment but it did cause it to start a nine-week long rally to kick start the new year. However, the black Thursday sent the ETH prices tumbled back to lower lows. Ethereum also fell over 85% on the ETH/BTC trading pair and since the bottom of the crypto trading pair, the second biggest asset grew by 54%.
The recovery is now in jeopardy as the TD sequential indicator issued a 9 sell setup on the ETH/BTC trading pair. the recent crash saw the capital flow into altcoins but the most accurate signal could be an omen that the things could soon get worse. The indecision candles on the altcoin chart paired with Bitcoin are visible on the weekly and monthly timeframes suggesting that the investors are at an impasse and aren’t sure where the price is headed.

The same signal has appeared on the ETH/USD pair. considering how accurate the TD 9 signal has been over the recent timeframe, there’s a strong possibility that prices will be headed down both in terms of USD and BTC. The TD Sequential indicator was designed by Thomas Demark where it can be seen that the signals show assets along with bitcoin could be led to a selloff on Monday as the new weekly opened.
DC Forecasts is a leader in many crypto news categories, striving for the highest journalistic standards and abiding by a strict set of editorial policies. If you are interested to offer your expertise or contribute to our news website, feel free to contact us at [email protected]


Discussion about this post