The price of XRP could double down this weekend while the optimism is getting back to the XRP holders. In our ripple news, we can see there is evidence that suggests the recent gains of XRP could be soon washed away.
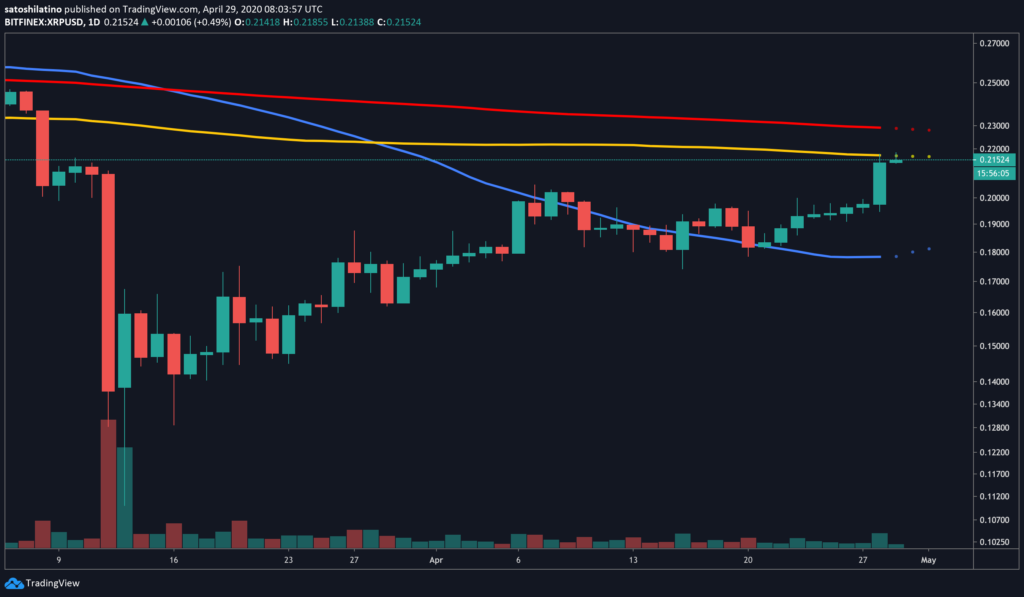
Over the past day, the price of XRP surged more than 12 percent and increased to $0.22. The upswing tested a resistance level which was presented by the 100 and 200-day moving averages. However, the TD sequential indicator predicts a new correction before the onward trend continues. As per the ripple news, the price of XRP could increase as it was enjoying a rally for a day but the technical index shows a retracement underway.
The crypto market is in the green again as speculation mounts up prior to the Bitcoin halving event. Over the past 24 hours, more than $10 billion flooded the market and this inflow was responsible for the boos tin price in multiple assets including Ripple’s XRP. In that short period, Ripple’s XRP went from trading at $0.195 to hitting a new high of $0.22.

The sudden bullish impulse helped the price recover from the recent losses including the one from Black Thursday. Now, according to the latest charts that we have in our XPR news, the altcoin faces a huge resistance level ahead and this barrier is presented by the 100-day moving average. Considering the significance of the supply zone, the barrier will be able to stop the upswing of the price of XRP. The TD sequential indicator also supports this idea.
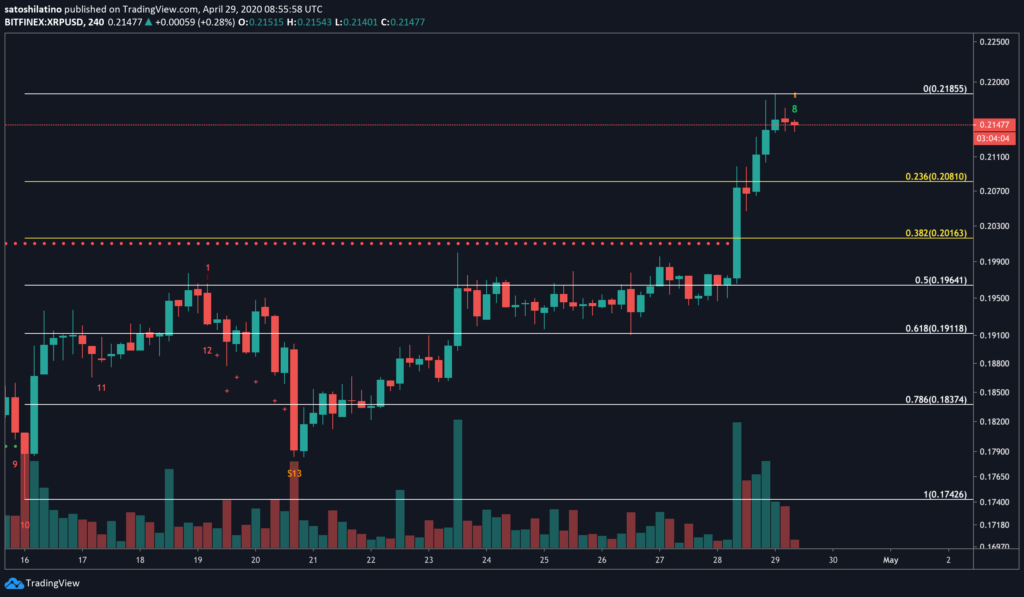
Based on the 4-hour chart, the TD indicator is currently on a green eight candlestick which suggests that a sell signal will develop in a nine green candlestick form. A bearish formation like this estimates a correction before the continuation of the uptrend. An increase in selling pressure behind XRP close to the current levels will likely validate the sell signal. If this is supposed to happen, we can expect that the cryptocurrency will drop to 23% or 38% Fibonacci retracement level.

The historical data reveals that the TD index was able to predict the local tops over the past month. Some of the biggest corrections including the ones that start on March 20 and April 19, were preceded with a green nine candlestick. The bearish outlook presented by the indicator has to be taken seriously because of the massive accuracy and resistance that lays ahead. An increase in demand will allow XRP to move past the 100 and 200-day moving average which could jeopardize the bearish outlook.
DC Forecasts is a leader in many crypto news categories, striving for the highest journalistic standards and abiding by a strict set of editorial policies. If you are interested to offer your expertise or contribute to our news website, feel free to contact us at [email protected]


Discussion about this post